


Key Takeaways
- Global expansion and a strong backlog position Nextracker to capitalize on rising solar demand and diversify earnings across multiple key regions.
- Advanced R&D and a resilient, locally focused supply chain support higher-margin, innovative product offerings and operational flexibility despite cost or regulatory changes.
- Sustained pricing pressure, reliance on government policy and large customers, and supply chain risks threaten margins and revenue stability in increasingly competitive international markets.
Catalysts
About Nextracker- An energy solutions company, provides solar tracker and software solutions for utility-scale and distributed generation solar projects in the United States and internationally.
- Nextracker’s record backlog, now exceeding 4.5 billion dollars and more than doubling since its IPO, combined with a book-to-bill ratio consistently above one, provides clear visibility and confidence in future revenue growth as global decarbonization policies and rising electricity demand fuel large-scale solar buildouts.
- Strategic international expansion—with new contracts across 13 countries and significant growth in Latin America, Europe, Australia, the Middle East, and India—positions Nextracker to capture outsized market share as solar markets in emerging economies accelerate, supporting both top-line revenue growth and geographic diversification of earnings.
- Accelerated investment in R&D, including partnerships with leading universities and a global scaling of innovation centers, is driving an expanding portfolio of differentiated products such as advanced software (TrueCapture, NX Navigator), new tracker solutions, and weather resilience features; these are expected to command higher margins and steadily boost recurring, high-margin software revenue as attach rates increase.
- Nextracker’s robust, locally optimized global supply chain—enabling 100% U.S. domestic content and rapid customer response—supports operational resiliency, leverages favorable policy tailwinds (such as increased ITC for domestic content), and is likely to provide pricing power and margin stability even amid potential tariffs or cost fluctuations.
- The convergence of rapidly falling solar and storage costs, increased hybrid project development, and industry consolidation is accelerating the shift toward utility-scale and bifacial solar arrays (which Nextracker’s technology specifically enables), suggesting a structural long-term expansion of its core addressable market that should drive sustained revenue and EBITDA growth.
Nextracker Future Earnings and Revenue Growth
Assumptions
How have these above catalysts been quantified?- This narrative explores a more optimistic perspective on Nextracker compared to the consensus, based on a Fair Value that aligns with the bullish cohort of analysts.
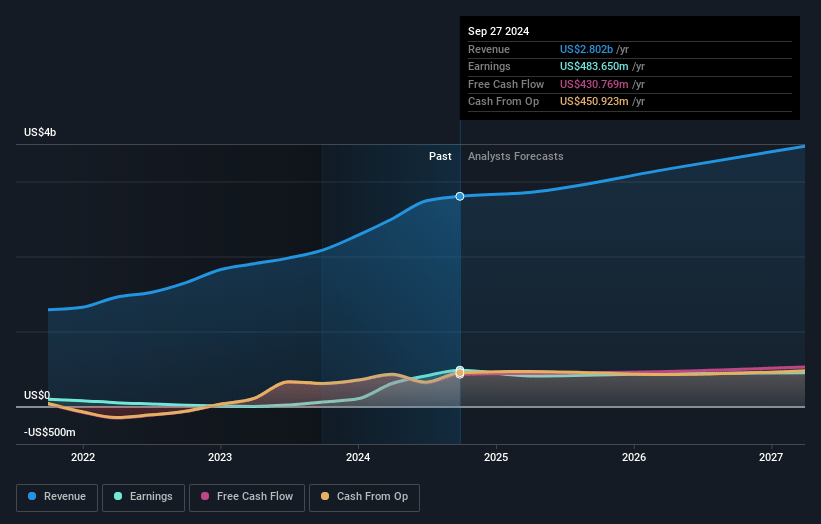
- The bullish analysts are assuming Nextracker's revenue will grow by 17.4% annually over the next 3 years.
- The bullish analysts assume that profit margins will shrink from 17.2% today to 13.9% in 3 years time.
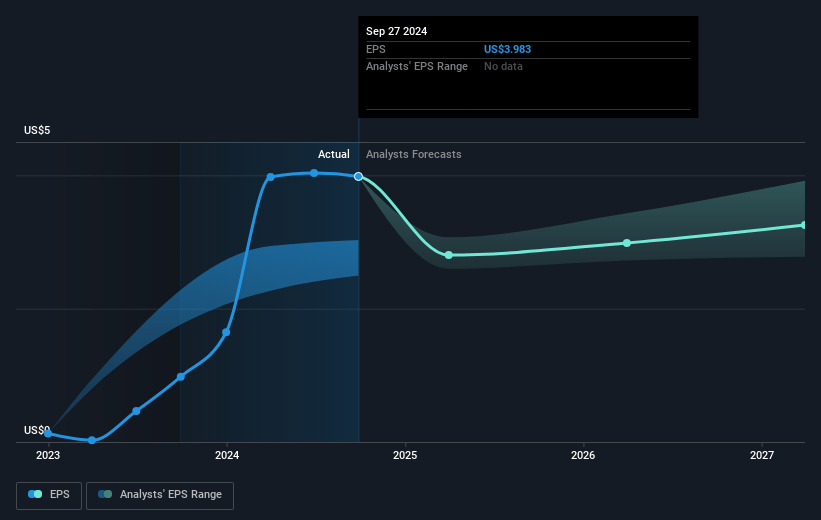
- The bullish analysts expect earnings to reach $666.1 million (and earnings per share of $4.75) by about July 2028, up from $509.2 million today. The analysts are largely in agreement about this estimate.
- In order for the above numbers to justify the price target of the more bullish analyst cohort, the company would need to trade at a PE ratio of 26.5x on those 2028 earnings, up from 18.0x today. This future PE is lower than the current PE for the US Electrical industry at 28.7x.
- Analysts expect the number of shares outstanding to grow by 1.97% per year for the next 3 years.
- To value all of this in today's terms, we will use a discount rate of 8.01%, as per the Simply Wall St company report.
Nextracker Future Earnings Per Share Growth
Risks
What could happen that would invalidate this narrative?- Pricing for tracker systems has historically declined as the solar industry scales, and management expects price reductions to continue in order to stay competitive with other energy technologies, which could put pressure on gross margins and long-term earnings.
- International markets are described as more capital-expenditure sensitive and highly competitive, creating downward pressure on pricing and increasing the risk of margin compression in Nextracker’s global operations, potentially impacting net profit as revenue mix shifts outside the U.S.
- The company’s robust backlog and growth trajectory are heavily dependent on large-scale project developers and on supportive government policies such as the U.S. Inflation Reduction Act, so any reduction or reversal in government subsidies or incentives could slow project pipelines and negatively affect overall revenue.
- The supply chain is touted as a core strength, but there are ongoing risks related to trade policy changes, tariffs, and geopolitical tensions, especially regarding raw materials like steel, which could lead to rising costs and potential disruptions, impacting operating expenses and net margins.
- Management notes that 80% of revenue is from repeat customers, indicating dependence on a concentrated customer base, which increases vulnerability to project delays or cancellations and could introduce volatility in quarterly revenue and earnings.
Valuation
How have all the factors above been brought together to estimate a fair value?- The assumed bullish price target for Nextracker is $89.72, which represents two standard deviations above the consensus price target of $65.78. This valuation is based on what can be assumed as the expectations of Nextracker's future earnings growth, profit margins and other risk factors from analysts on the bullish end of the spectrum.
- However, there is a degree of disagreement amongst analysts, with the most bullish reporting a price target of $97.0, and the most bearish reporting a price target of just $35.56.
- In order for you to agree with the bullish analysts, you'd need to believe that by 2028, revenues will be $4.8 billion, earnings will come to $666.1 million, and it would be trading on a PE ratio of 26.5x, assuming you use a discount rate of 8.0%.
- Given the current share price of $62.1, the bullish analyst price target of $89.72 is 30.8% higher.
- We always encourage you to reach your own conclusions though. So sense check these analyst numbers against your own assumptions and expectations based on your understanding of the business and what you believe is probable.
How well do narratives help inform your perspective?
Disclaimer
AnalystHighTarget is a tool utilizing a Large Language Model (LLM) that ingests data on consensus price targets, forecasted revenue and earnings figures, as well as the transcripts of earnings calls to produce qualitative analysis. The narratives produced by AnalystHighTarget are general in nature and are based solely on analyst data and publicly-available material published by the respective companies. These scenarios are not indicative of the company's future performance and are exploratory in nature. Simply Wall St has no position in the company(s) mentioned. Simply Wall St may provide the securities issuer or related entities with website advertising services for a fee, on an arm's length basis. These relationships have no impact on the way we conduct our business, the content we host, or how our content is served to users. The price targets and estimates used are consensus data, and do not constitute a recommendation to buy or sell any stock, and they do not take account of your objectives, or your financial situation. Note that AnalystHighTarget's analysis may not factor in the latest price-sensitive company announcements or qualitative material.
Read more narratives


