


Catalysts
About John Wood Group
John Wood Group is a global engineering and consulting company serving energy and materials markets through complex project delivery, operations and digital solutions.
What are the underlying business or industry changes driving this perspective?
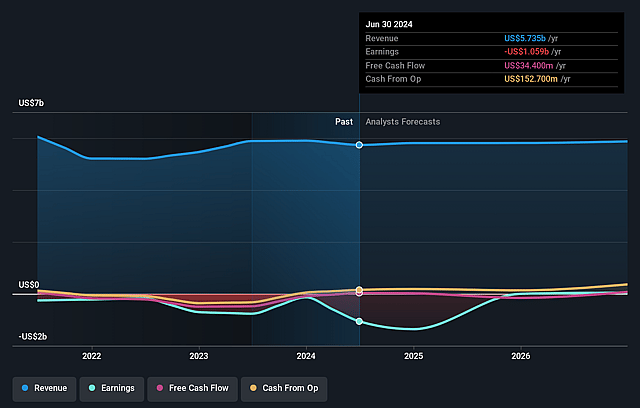
- The order book has expanded and is now around $6.5 billion, compared to $5.8 billion at the end of 2024. This points to stronger future activity levels that may support a sustained recovery in revenue and improve earnings visibility.
- Client momentum with major energy companies such as BP, Shell, TotalEnergies, Woodside and OMV underlines resilient demand for high-end engineering and EPCM services. This can translate into higher utilisation rates, better pricing power and expanding net margins.
- Growing demand across global energy and materials markets for complex brownfield upgrades, decarbonisation projects and large-scale developments positions Wood to capture higher-value scopes, supporting a mix-driven uplift in adjusted EBIT and potentially contributing to long-term earnings growth.
- Completion of legacy contracts and progress on resolving associated disputes reduces operational drag and volatility. This may improve cash conversion, stabilise net margins and allow more of any incremental revenue growth to flow through to the bottom line.
- The proposed Sidara transaction, including an initial $250 million capital injection and extension of debt facilities to 2028, is expected to strengthen liquidity and bonding capacity. This could enable Wood to pursue larger projects, potentially accelerate revenue growth and support more efficient use of capital.
Assumptions
This narrative explores a more optimistic perspective on John Wood Group compared to the consensus, based on a Fair Value that aligns with the bullish cohort of analysts. How have these above catalysts been quantified?
- The bullish analysts are assuming John Wood Group's revenue will remain fairly flat over the next 3 years.
- The bullish analysts assume that profit margins will increase from -39.4% today to 1.5% in 3 years time.
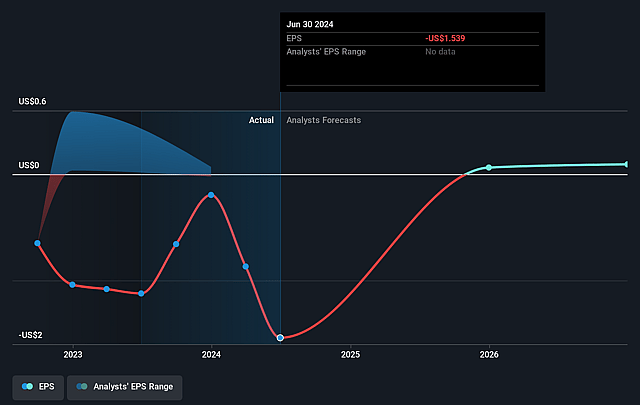
- The bullish analysts expect earnings to reach $71.8 million (and earnings per share of $0.11) by about December 2028, up from $-1.9 billion today. The analysts are largely in agreement about this estimate.
- In order for the above numbers to justify the price target of the more bullish analyst cohort, the company would need to trade at a PE ratio of 12.2x on those 2028 earnings, up from -0.1x today. This future PE is greater than the current PE for the GB Energy Services industry at 6.8x.
- The bullish analysts expect the number of shares outstanding to decline by 0.15% per year for the next 3 years.
- To value all of this in today's terms, we will use a discount rate of 13.19%, as per the Simply Wall St company report.
Risks
What could happen that would invalidate this narrative?
- The group is emerging from a period of material accounting restatements, governance failures and reliance on external technical support, and any further control weaknesses or misstatements could erode stakeholder confidence, constrain access to capital and weaken the company’s ability to convert its $6.5 billion order book into sustainable revenue and earnings growth over the long term, pressuring both revenue and net margins.
- Despite strong secular demand in energy and materials, Wood’s core franchises are currently under-earning, with 2024 adjusted EBIT down 52 percent and underlying profit falling across all business units. This suggests that structurally weaker pricing, poor contract selection and execution risk may be embedded in the portfolio and could continue to depress long term net margins and earnings.
- Historical exposure to loss making and highly complex legacy contracts, including large scale EPC and government work such as the Aegis contract, indicates that the business model remains vulnerable to disputes, provisioning and write downs over multi year periods. Any continuation of these patterns would absorb cash, limit reinvestment capacity and weigh on reported earnings.
- Wood’s capital structure is fragile, with average net debt close to $800 million, a 2024 free cash outflow of $153 million and dependence on the Sidara transaction for a $250 million capital injection and extended debt facilities. Any delay, failure or post deal underperformance could leave the company liquidity constrained, restrict bonding capacity for new projects and cap long run revenue growth and earnings recovery.
- The 2024 statutory loss of $2.8 billion, including a $2.2 billion goodwill and intangibles impairment driven by higher discount rates and increased risk assumptions in the Projects division, reflects a structurally more cautious view of future cash flows. If macro headwinds, client program delays and internal execution issues persist, long term revenue trajectories and achievable net margins may fall short of the levels implied by a rising share price narrative.
Valuation
How have all the factors above been brought together to estimate a fair value?
- The assumed bullish price target for John Wood Group is £0.66, which represents up to two standard deviations above the consensus price target of £0.52. This valuation is based on what can be assumed as the expectations of John Wood Group's future earnings growth, profit margins and other risk factors from analysts on the bullish end of the spectrum.
- However, there is a degree of disagreement amongst analysts, with the most bullish reporting a price target of £0.66, and the most bearish reporting a price target of just £0.3.
- In order for you to agree with the more bullish analyst cohort, you'd need to believe that by 2028, revenues will be $4.9 billion, earnings will come to $71.8 million, and it would be trading on a PE ratio of 12.2x, assuming you use a discount rate of 13.2%.
- Given the current share price of £0.24, the analyst price target of £0.66 is 63.4% higher.
- We always encourage you to reach your own conclusions though. So sense check these analyst numbers against your own assumptions and expectations based on your understanding of the business and what you believe is probable.
Have other thoughts on John Wood Group?
Create your own narrative on this stock, and estimate its Fair Value using our Valuator tool.
Create NarrativeHow well do narratives help inform your perspective?
Disclaimer
AnalystHighTarget is a tool utilizing a Large Language Model (LLM) that ingests data on consensus price targets, forecasted revenue and earnings figures, as well as the transcripts of earnings calls to produce qualitative analysis. The narratives produced by AnalystHighTarget are general in nature and are based solely on analyst data and publicly-available material published by the respective companies. These scenarios are not indicative of the company's future performance and are exploratory in nature. Simply Wall St has no position in the company(s) mentioned. Simply Wall St may provide the securities issuer or related entities with website advertising services for a fee, on an arm's length basis. These relationships have no impact on the way we conduct our business, the content we host, or how our content is served to users. The price targets and estimates used are consensus data, and do not constitute a recommendation to buy or sell any stock, and they do not take account of your objectives, or your financial situation. Note that AnalystHighTarget's analysis may not factor in the latest price-sensitive company announcements or qualitative material.

