
“The intelligent investor is a realist who sells to optimists and buys from pessimists.” - Benjamin Graham
It’s hard to think we’re nearly halfway through 2023!
In just the last month, we’ve had US debt ceiling talks go from global crisis mode to a potential resolution (still to be determined), and inflation has reared its ugly head again as April Year-over-Year figures came in slightly hotter than March’s figures.
Some emerging markets like India, Brazil, and Argentina all rose last month thanks to the surprisingly stronger USD. The US tech sector rose 11%, as investors flocked to Nvidia and its other big tech counterparts as the mention of A.I. in earnings calls had people licking their lips.
The large cap outperformance we’ve seen has mostly been a “year-to-date” thing. Over the pond in the UK however, large cap stocks have been outperforming smaller companies since the beginning of 2022 .
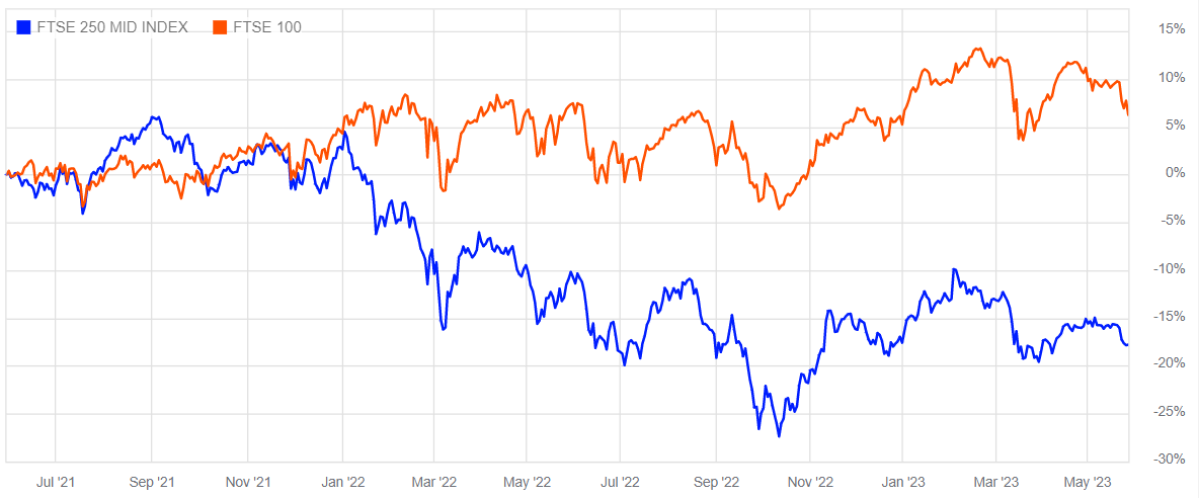
In fact, the FTSE 100 (in orange below) is one of a handful of benchmark indexes to print a new record high this year. Over the same period, the FTSE 250 (blue) has fallen nearly 20%.
So today we’re looking at UK stock price performance, valuations, and where some opportunities may lie.
How The Stars Aligned For UK Large Caps
The FTSE 100 includes the UK’s largest 100 companies, while the FTSE 250 includes the companies ranked 101 to 350 by market cap. The difference in performance can be explained by two factors:
1. Sector Composition
| FTSE 100 | FTSE 250 |
| Financials: 19% | Financials: 39% |
| Consumer staples: 18% | Industrials: 15% |
| Energy: 13% | Consumer Discretionary: 13% |
| Healthcare: 12% | Real Estate: 9% |
| Materials: 10% | Technology: 5% |
These are the largest sectors in each index. The FTSE 100 clearly benefited from substantial exposure to energy, consumer staples and materials, three of the top performing sectors of 2022. It also helped that the largest banks held up remarkably well during the recent turmoil.
During the same period the FTSE 250 suffered from higher exposure to the worst performing sectors of 2022: consumer discretionary, real estate and technology.
2. Regional Exposure And A Weak UK Currency
Most of the UK’s largest companies operate globally. That means a big chunk of their revenues comes from outside the UK. In 2022, when the GBP collapsed those companies got an extra boost to their earnings when foreign revenue was converted into cheaper GBP.
So while the UK’s economy suffered from multiple crises (crippling inflation, a sell-off in the GBP and bonds, and three PMs in two months to name a few), some of the index heavyweights were setting new profit records. Some of the biggest companies, including Astrazeneca, BP, Shell, HSBC, Unilever, Diageo have reported record revenues and/or profits over the last 18 months.
Meanwhile, the mid cap companies in the FTSE 250 which tend to have more exposure to the local UK economy, struggled with falling sales and rising costs.
Where Does This Leave Valuations?
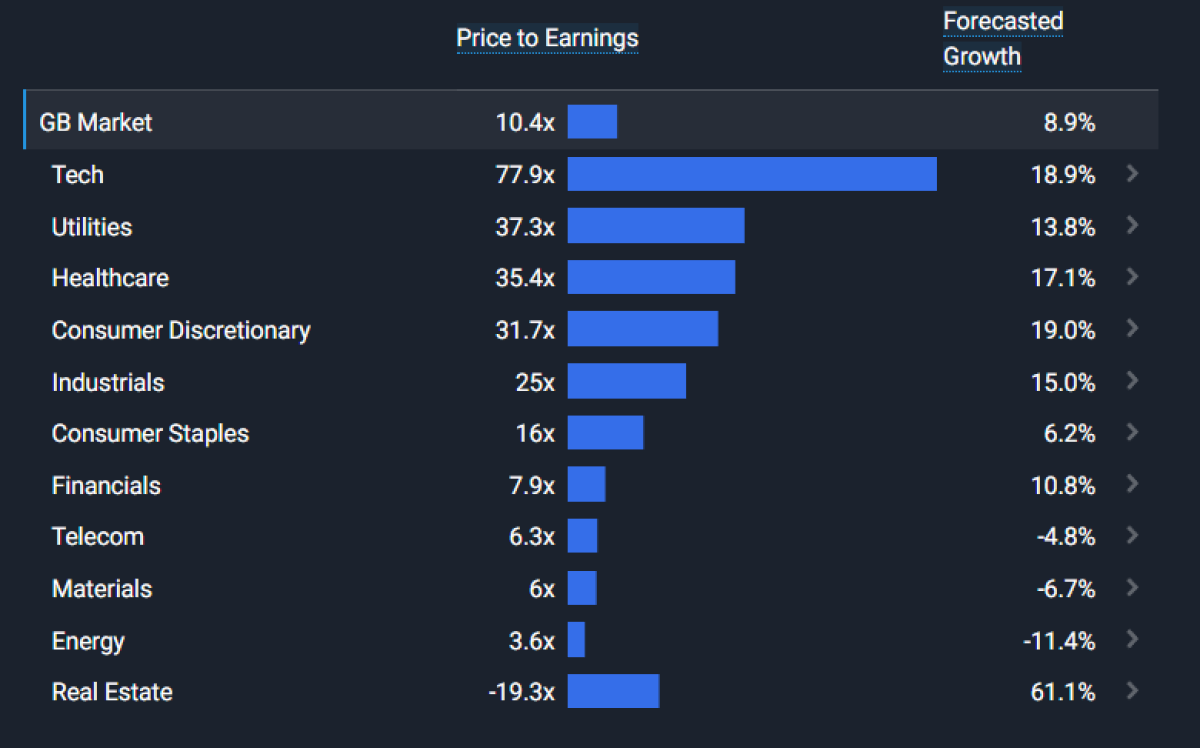
Although the UK’s benchmark index is close to a record high, the market’s price-earnings ratio is still at 10.4x, which is less than half the 10 year average of 22.4x. Looks like a bargain right?
Well, not exactly - as the graphic below shows, earnings growth is expected to be quite modest for some of those sectors, and negative in the case of energy and materials.
Commodity prices have fallen, while multinationals won’t benefit from the currency which has recovered most of 2022’s losses. If earnings fall, PE ratios will rise.
What Does The CAPE Ratio Say?
Price-Earnings ratios can be a little misleading when trailing 12-month EPS are used if those earnings are affected by ‘non-recurring’ events. Read: huge, one off benefits.
This is when the CAPE, or cyclically adjusted PE , ratio can be useful. This ratio compares the current price to the inflation adjusted EPS average for the last 10 years. This also reduces the effect of business cycles, so it's useful for cyclical stocks, though maybe less relevant for growth stocks.
CAPE ratios are also useful for comparing equity markets with one another and with their historical averages.
Barclays CIB calculates the UK’s current CAPE ratio at 16.4x, compared to an average of 17.5x for the last 40 years and 16.2x for the last 10 years.
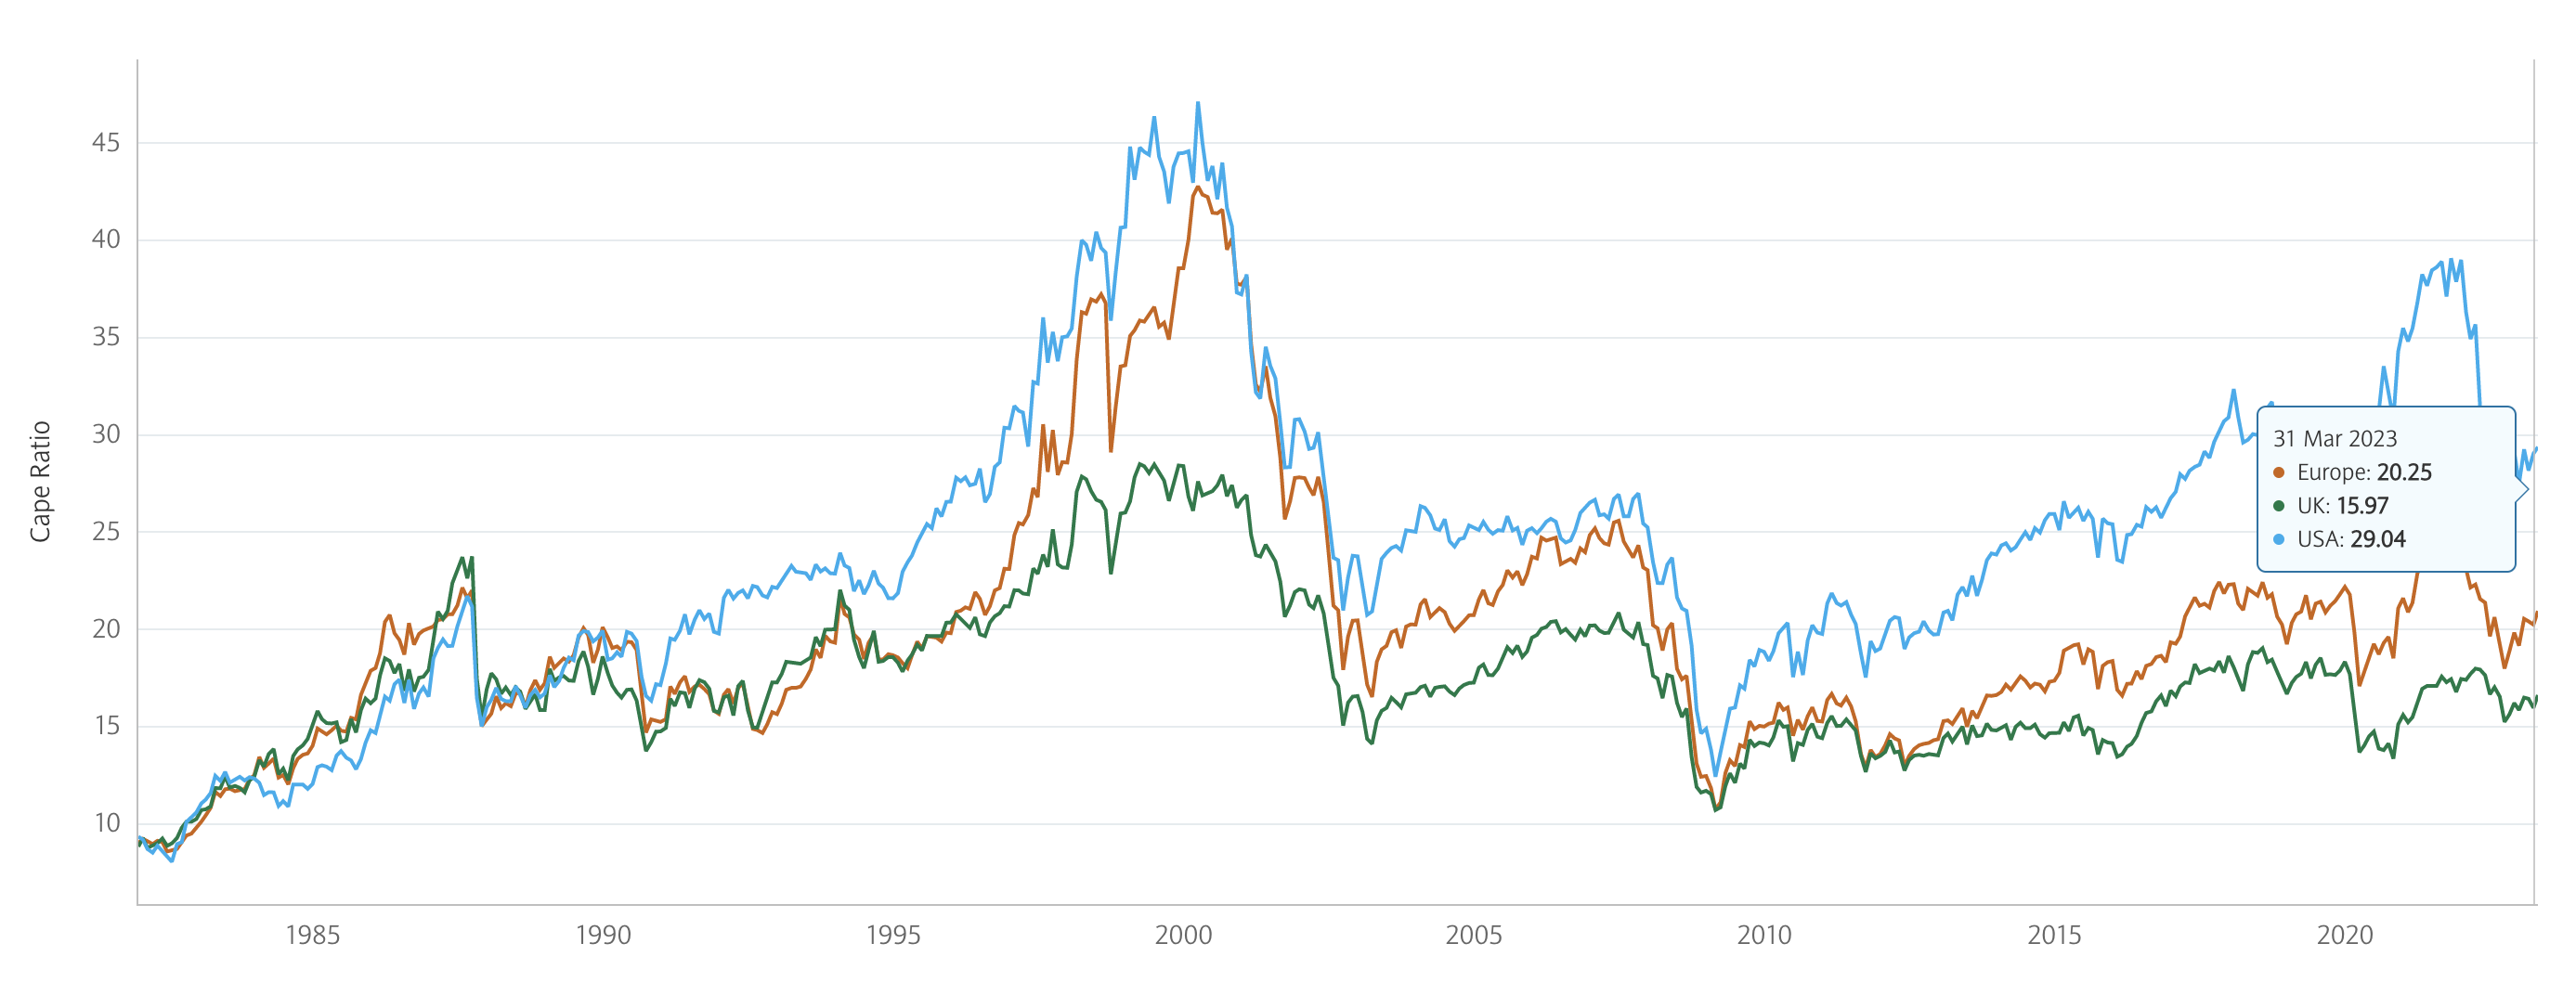
So, the current ratio is very close to the historical average. However, it is currently lower than most developed markets - so possibly more attractive, if only on a relative basis. You can see how the ratios for other countries compare to their historical average and to one another on Barclays’ website.
So why is the PE ratio so much lower than its long term average, when the CAPE is so close to its long term average? Well, in the Price/Earnings ratio, the earnings (denominator) has increased faster than the price (numerator), which has consequently lowered the ratio. As mentioned earlier, those index heavyweights have been setting record profits, so they’ve helped increase the denominator, while the prices haven’t increased as much. Considering current inflation is far greater than the 10-year average, these record corporate profits appear much more reasonable when adjusted to real-terms (removing the impact of super hot inflation), which is why the inflation-adjusted CAPE seems much more reasonable than the non-adjusted market PE.
Why haven’t prices (stock values) increased as much as earnings? Investors simply don’t expect that earnings growth to continue, so they’re not willing to pay a higher price for those current higher earnings.
That’s why it’s helpful to use the CAPE ratio in these scenarios, because we get the inflation adjusted ratio, which shows us how much these companies' earnings were benefiting from inflation.
💡The Insight: Look For Pockets Of Value, Rather Than Market Averages
UK equities might not be as ‘cheap’ as they first appear - but we need to remember that’s just the market average . Within each sector there may well be opportunities, particularly amongst the small and mid-cap companies with local exposure.
When the macro news is bad, and markets decline, there are often quality companies that “get thrown out with the bathwater” and decline alongside their lower quality peers. It’s up to us to look through the stocks we understand well and identify when the market has oversold a great business with good long term prospects.
The UK economy has had a rough time since 2015. First there was uncertainty about the terms of the Brexit deal and the repercussions of that deal, then the Covid pandemic, and then war in Europe, double digit inflation, and a currency crisis. That’s almost 10 years of uncertainty, resulting in little confidence amongst investors, businesses, and consumers.
So far this year the UK economy has performed slightly better than expected, and some economists now think the country might avoid a recession. Beyond that, and assuming another crisis doesn’t come along, the UK could see a period in the next few years of improving confidence and a virtuous cycle of investment, spending, and growth.
This would be a great environment for the smaller companies that have struggled through the last 8 years, and particularly those with a proven competitive advantage and a solid balance sheet.
What Else is Happening?
First a recap of the key data releases we mentioned last week…
- 🇺🇸 US
- The JOLTS job opening report came in a little hotter than the market was hoping for. Job vacancies rose to 10.1 million compared to the 9.4 million expected. This prompted fears that the Fed would be less likely to stop hiking rates. Last month the number was lower than expected - and had the opposite effect. As always, we shouldn’t pay too much attention to a single data point.
- The JOLTS job opening report came in a little hotter than the market was hoping for. Job vacancies rose to 10.1 million compared to the 9.4 million expected. This prompted fears that the Fed would be less likely to stop hiking rates. Last month the number was lower than expected - and had the opposite effect. As always, we shouldn’t pay too much attention to a single data point.
- 🇪🇺 Europe
- 🇩🇪 Germany and 🇫🇷 France both recorded a bigger than expected decline in inflation. France posted a YoY inflation rate of 5.1% , a greater decline than the 5.5% consensus figures, Their German neighbors reported a 6.1% YoY inflation rate, also coming in less than the 6.5% expected by analysts. Also in Europe, the ECB’s Financial Stability Review noted that “the potential for “disorderly adjustments” in financial markets had spiked against a backdrop of tighter financial conditions and lower market liquidity.”
And then, a few news items that we thought were worth noting…
- 🤖 Nvidia unveiled a new batch of AI products two days after announcing blockbuster results. Included were an AI supercomputer platform, services for the gaming and digital ad industry, and a system to speed up data transfer speeds in data centers.
- These products and services could all make Nvidia even more essential for any company wanting to work with AI.
- This is a great example of a company widening its moat while it has everyone’s attention.
- 📉 An even bigger beneficiary of the AI hype machine, C3.ai, fell 25% after reporting results that were mostly in line with guidance issued just two weeks ago .
- The stock price is still up nearly 200% for the year, but that might have more to do do with the name than the business.
Key Events During the Next Week
Last week was heavy on employment data - this week it's all about trade data. Trade balances will be released in Germany on Monday, and in China, Canada, and the US on Wednesday, and in Australia on Thursday.
Also in Australia, the latest interest rate decision will be announced by the Reserve Bank of Australia on Tuesday (expected to be unchanged at 3.85%), and GDP data is out on Wednesday.
As earnings season winds down there are just a few companies reporting this week:
Have feedback on this article? Concerned about the content? Get in touch with us directly. Alternatively, email editorial-team@simplywallst.com
Simply Wall St analyst Richard Bowman and Simply Wall St have no position in any of the companies mentioned. This article is general in nature. We provide commentary based on historical data and analyst forecasts only using an unbiased methodology and our articles are not intended to be financial advice. It does not constitute a recommendation to buy or sell any stock and does not take account of your objectives, or your financial situation. We aim to bring you long-term focused analysis driven by fundamental data. Note that our analysis may not factor in the latest price-sensitive company announcements or qualitative material.
Richard Bowman
Richard is an analyst, writer and investor based in Cape Town, South Africa. He has written for several online investment publications and continues to do so. Richard is fascinated by economics, financial markets and behavioral finance. He is also passionate about tools and content that make investing accessible to everyone.

