What's Happened in the Market This Week?
Market Insights for 6th May - 13th May 2022
So far, Q2 2022 is shaping to be a quarter where positive weeks are a rarity for market indexes. Even though the US Consumer Price Index printed 8.3% for April which is down from the 8.5% recorded in March, it's too early to say if inflation has peaked.
- Major stock indices are sliding – all major indices are down year-to-date, with Nasdaq leading the decline
- There is less liquidity in the market – The Federal Reserve is warning about deteriorating liquidity conditions, but they are a part of the problem too
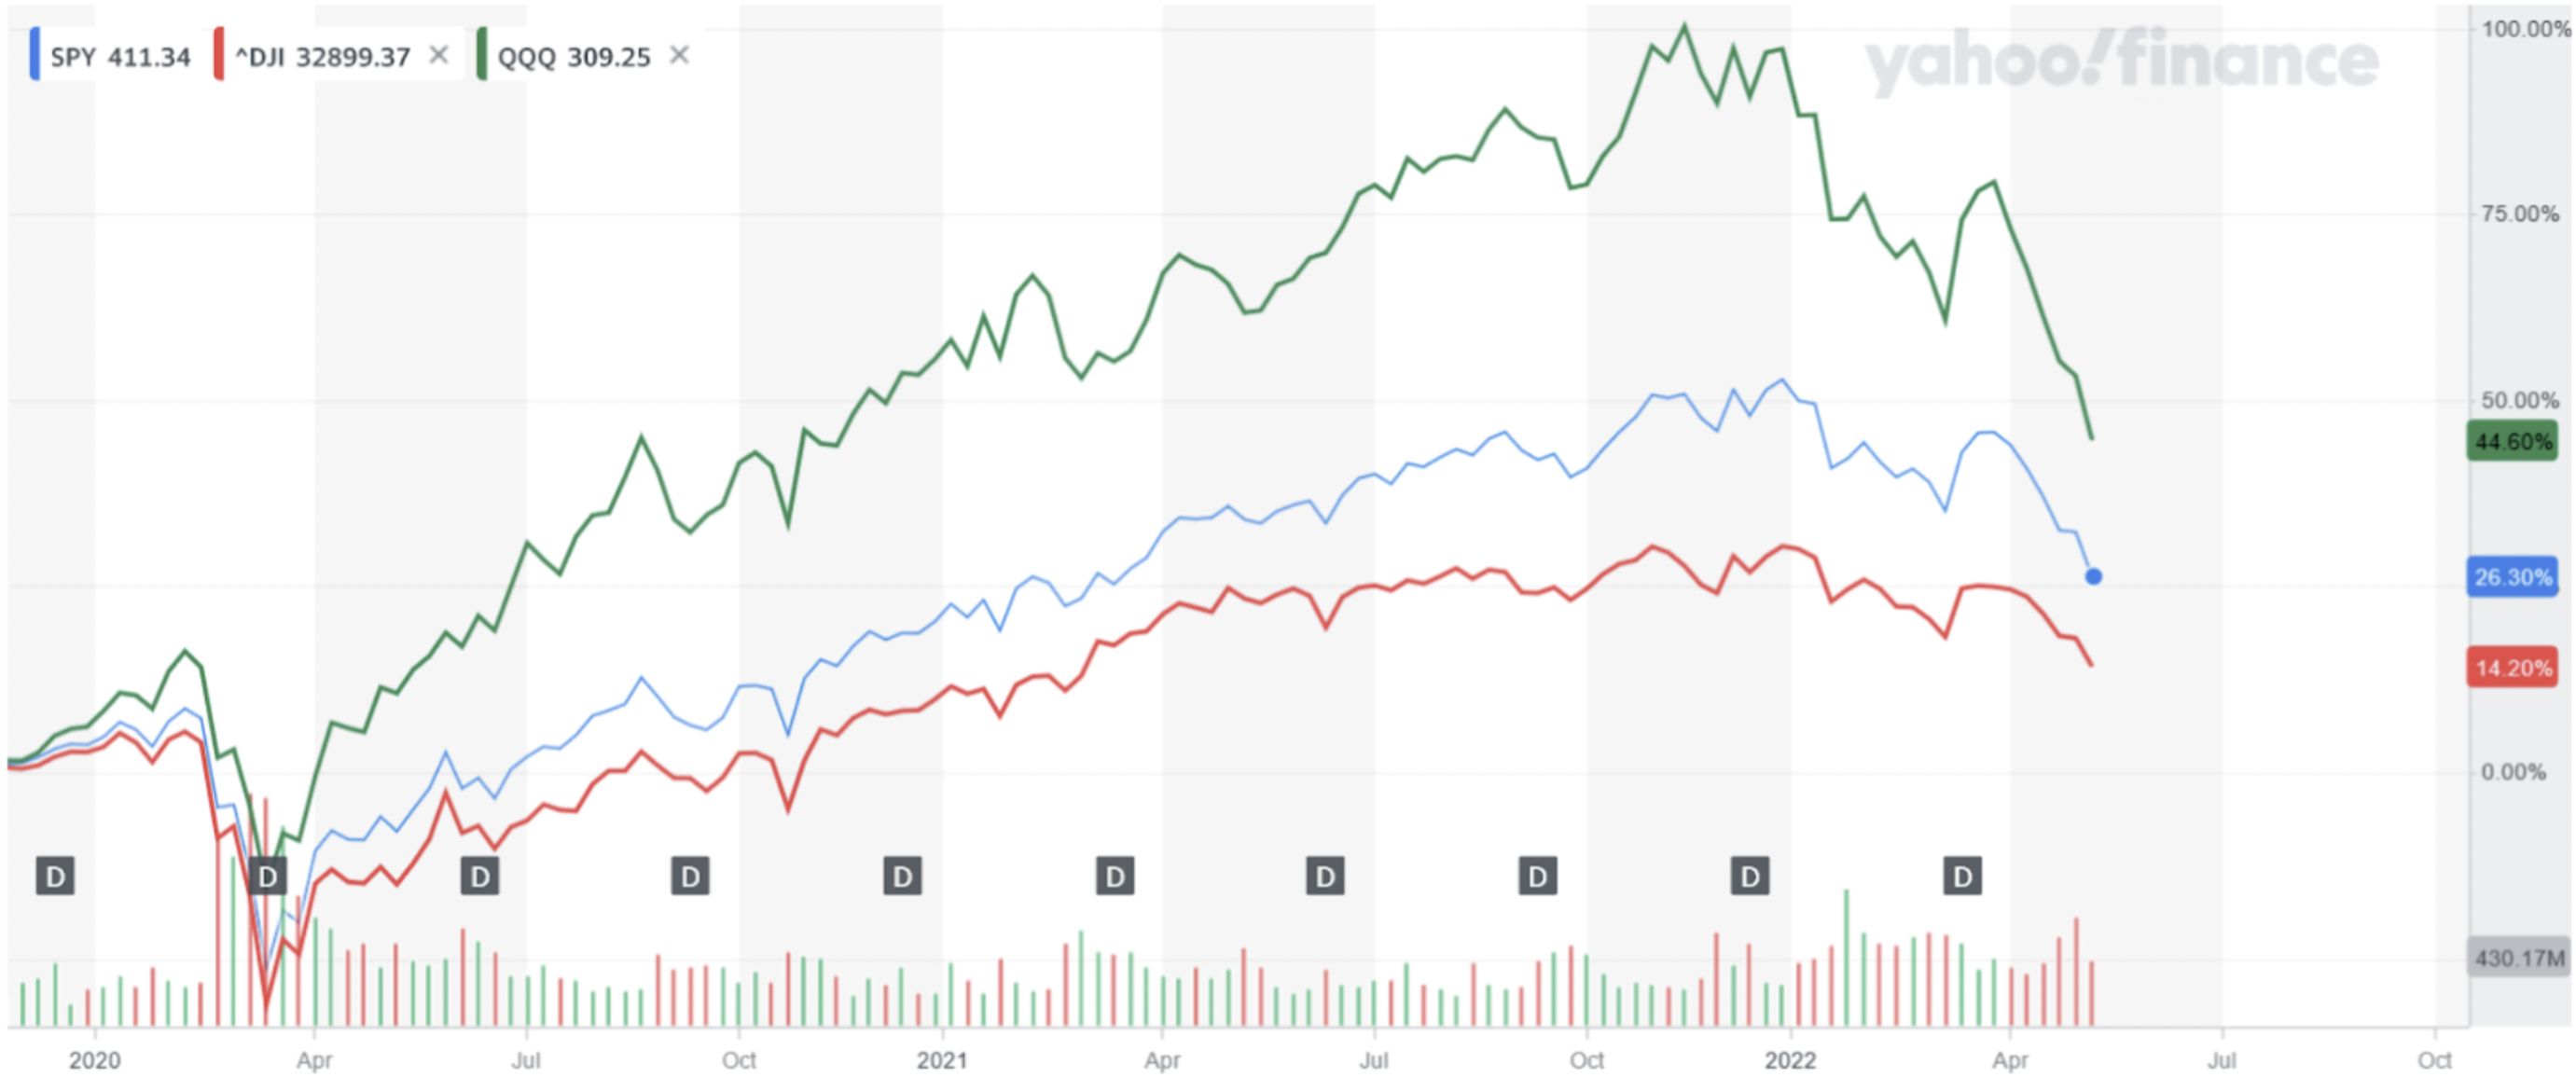
For comparison, here’s the performance of 3 major US indices since the start of the pandemic:

Major Stock Indices Sliding
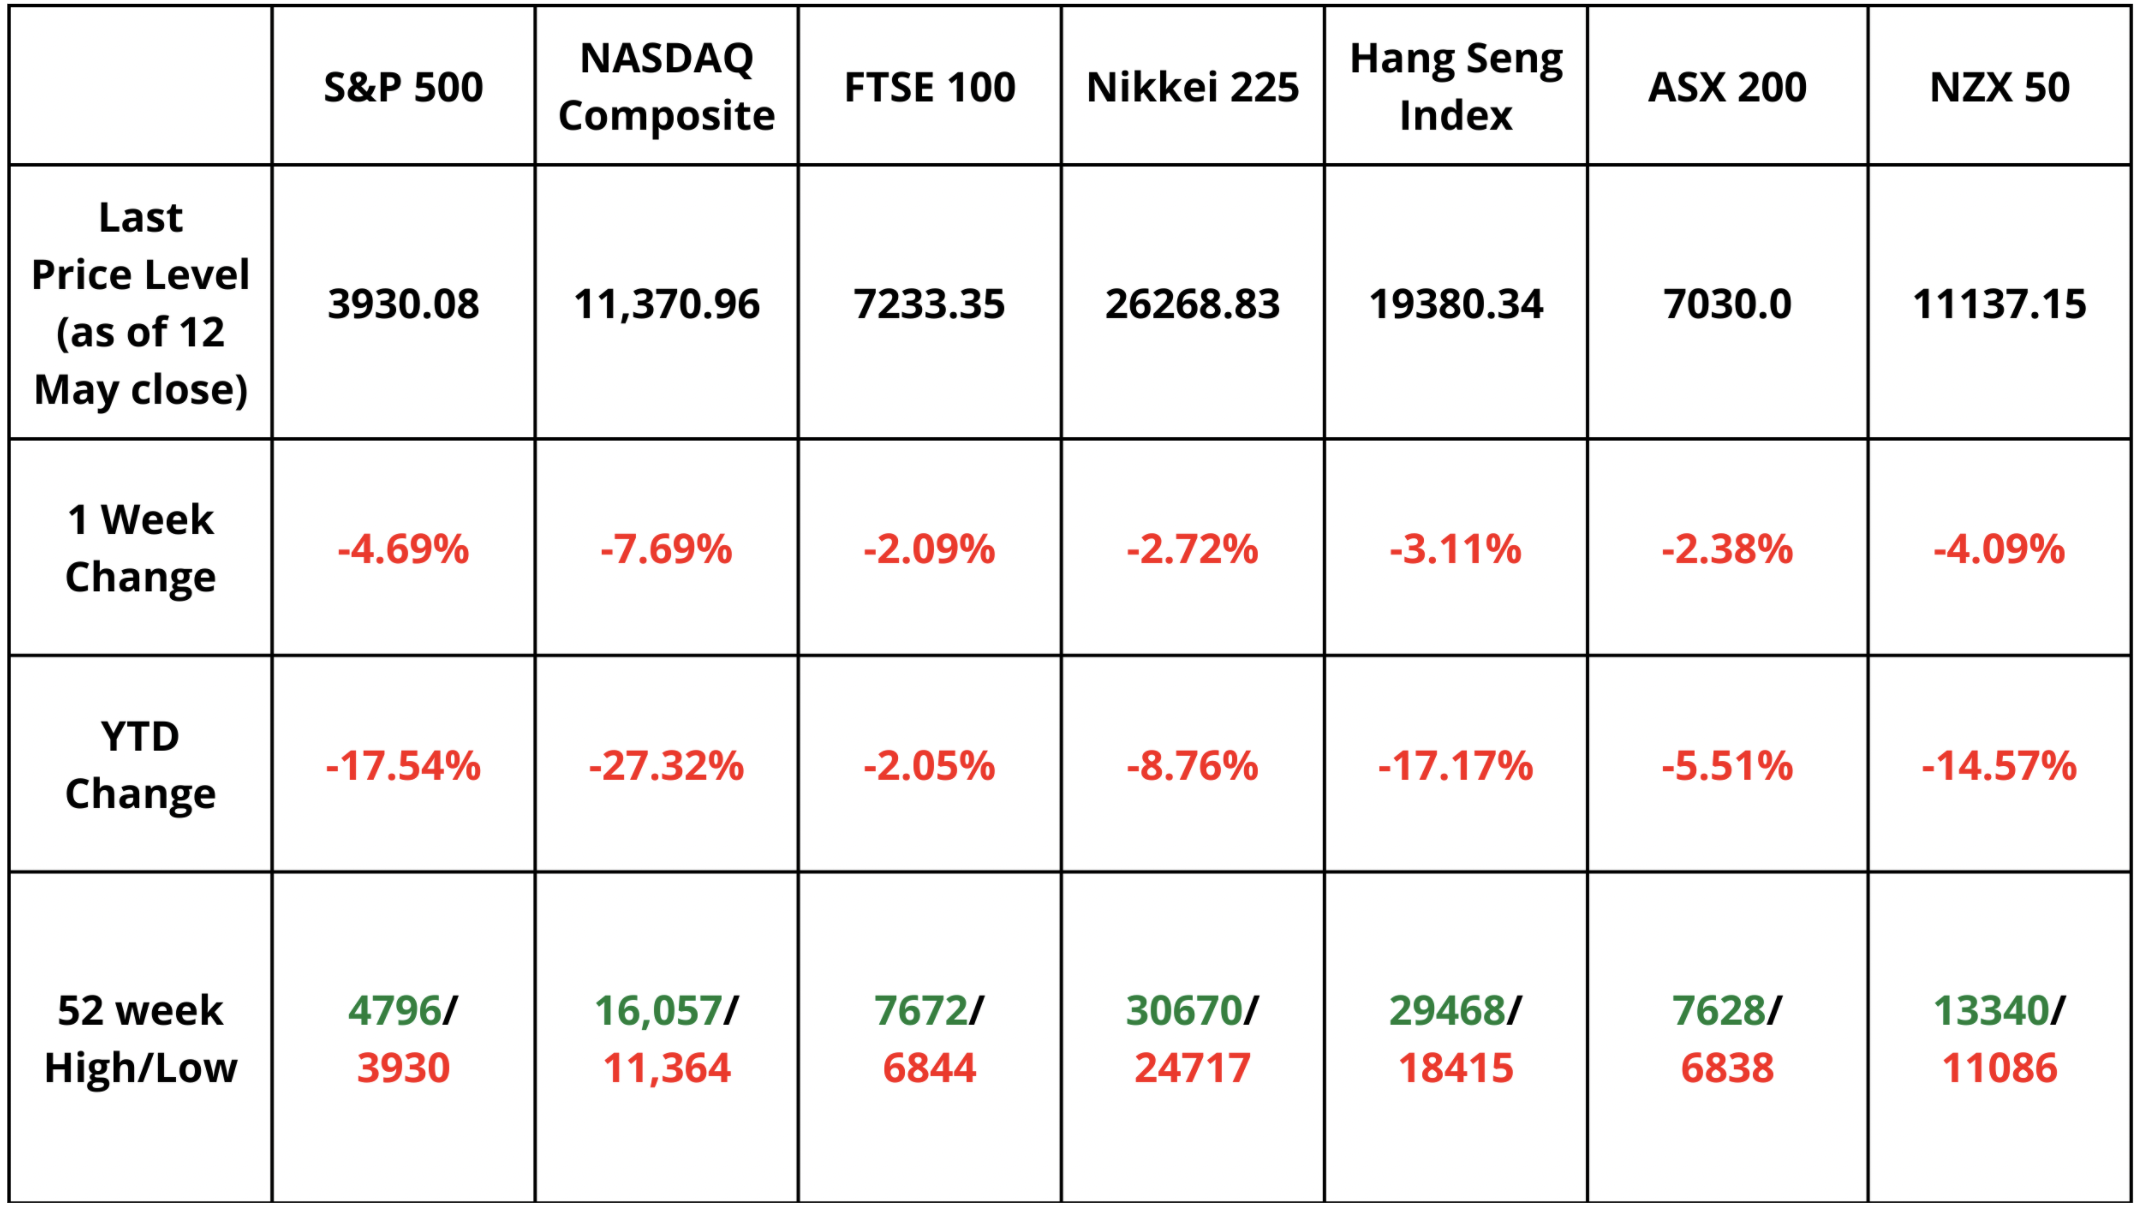
It's not just the US experiencing these declines. Major stock indices all over the world slid this week as the market sell-off continued. Both the S&P 500 and the NASDAQ Composite hit their YTD (year-to-date) lows on Thursday this week, and the Nikkei 225, Hang Seng Index, ASX-200, and the NZX 50 are all well below their 52-week highs. The chart below illustrates the movement of the indices more clearly.

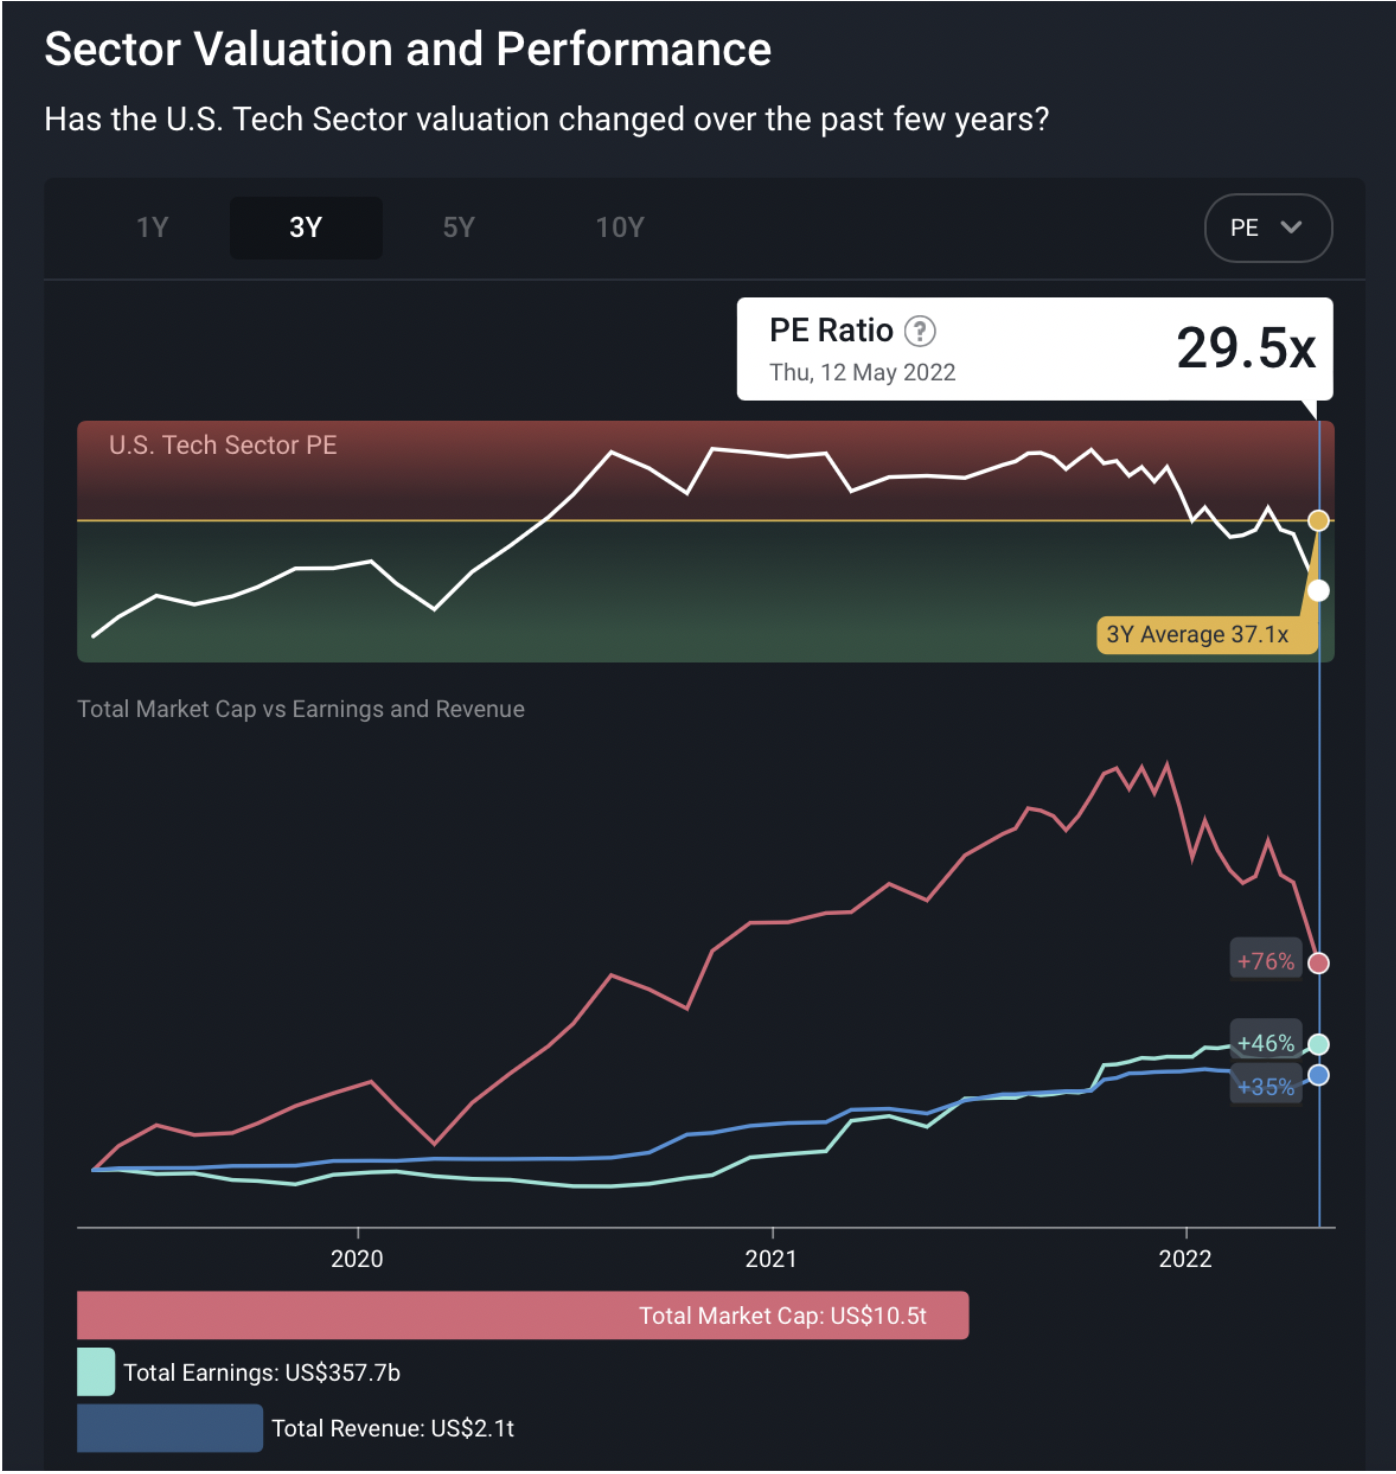
The Nasdaq, which rallied the most in the Pandemic aftermath, is now falling the hardest. The drop in the last months virtually erased US$7tn of gains that were created after vaccine announcements in November of 2020. Overall, the US Tech sector has dropped from a P/E of 44x in the middle of last year, to 29.5x today.

An analyst from the Bank of America succinctly interpreted the current market situation as “inflation shock is worsening, rate shock is just beginning and recession shock is coming” . A recession represents a slowdown or contraction in a country’s economic activities, which is defined as two successive quarters of negative GDP growth.
With interest rates on the rise, the 10-year treasury soared to touch 3.2% for the first time in years. This is a significant development as treasury yields are a popular “risk-free” benchmark. A year ago it hovered at about 1.5% while stock market returns were notably higher than that. In absence of those same returns and with high inflation, suddenly a safe yield above 3% might be more appealing to investors who would’ve otherwise invested in stocks.
Insight: The U.S. market has lost 21.6% year-to-date, bringing the valuation to 22x earnings (P/E), well below its 3-year average of 33x. However, buying the broad market now could be akin to catching a falling knife.
Long term investors do well in these periods by referring to their Watchlist which contains companies they understand, that possess solid fundamentals, and then waiting until the market provides them with an opportunity to buy them at attractive valuations.
Consequences of less liquidity in the market
Every market consists of buyers and sellers, with aggregate liquidity at any point being displayed as market depth. This measurement represents how much volume is behind each order placed, and typically the bigger, more popular stocks have lots of liquidity compared to smaller stocks that are less traded.
Naturally, the larger the market depth, the cheaper and more orderly it is to trade, since investors don’t have large spreads between buy and sell prices. Thus, liquidity risk is the risk of being unable to buy or sell assets of a given size over a given period of time without adversely impacting that asset's market price.
More recently, it appears like many investors are sitting on the sidelines rather than buying the dip, which is leading to the above issues mentioned. Market commentators like Mohammad El-Erian think that markets have likely already “priced in'' interest rate risk , but they haven’t priced in liquidity risk or credit risk .
Stocks typically trade at much higher earnings multiples than private businesses do because the stock market provides investors with huge amounts of liquidity where you can buy or sell your holdings in a matter of seconds. Whereas selling your own private business, or even a part of it, can take weeks to find a buyer, let alone settle the transaction. Therefore stock investors are willing to pay up for that privilege, and that’s one of the large appeals of being a public company. However when that liquidity reduces, investors don’t typically want to pay as much as they did before.
For example, if you desperately have to sell a stock investment quickly to repay an obligation, but there’s not enough bidders to buy all of what you’re trying to sell, you’re in trouble. You’ll take whatever price you can, which might be much lower than what the last traded price was.
Additionally, monetary policy decisions impacts the amount of liquidity in markets as well.
One of the most prominent market bubbles happened in 2000, as valuations of tech companies flew through the roof. Looking back, it was evident that the market got over-excited by this new technology and incorrectly predicted the scope of its adoption at the time.
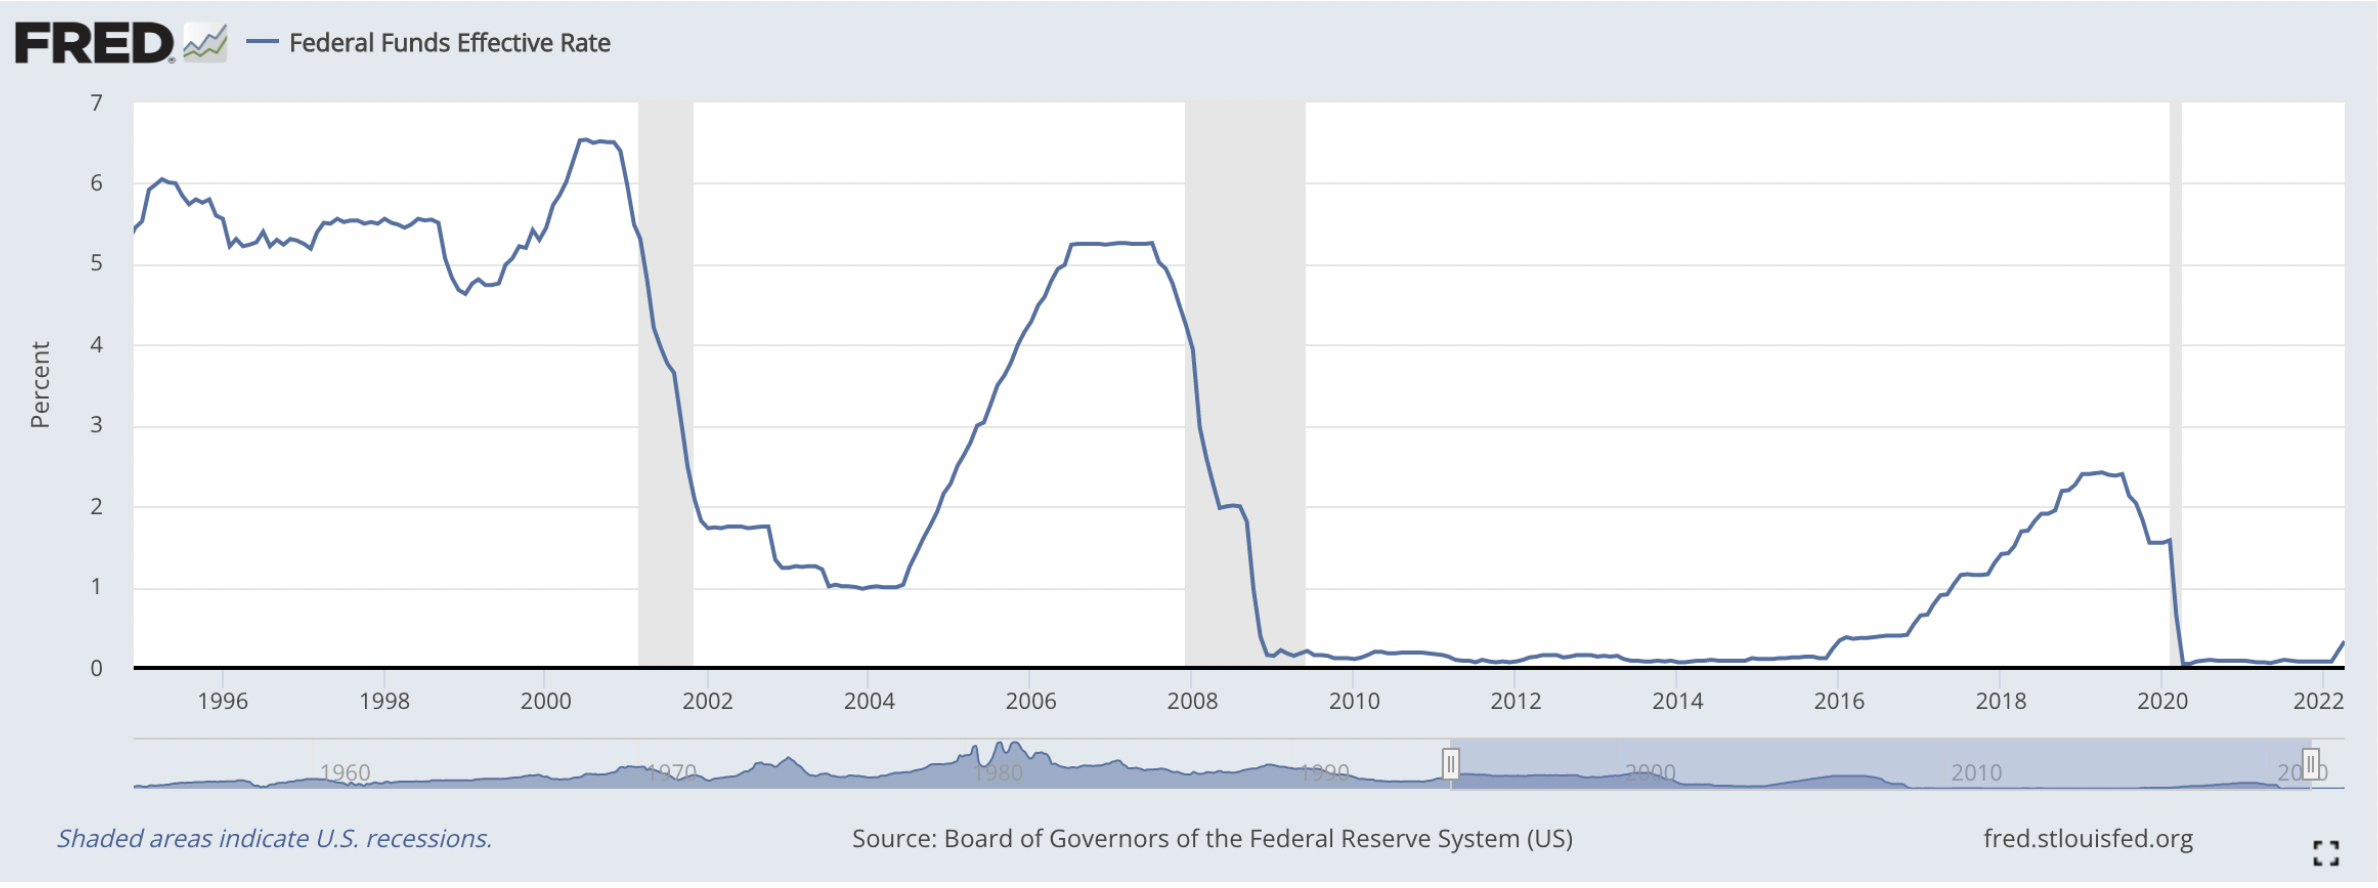
However, many forget that monetary policy also played a part in this development. In 1998, the collapse of Long-Term Capital Management forced the U.S. Federal Reserve to ease monetary policy and cut rates 3 times, despite unemployment at just 4.5% and worries about inflation. Then, in 1999, they reversed course and raised rates 3 times before the market started toppling over in 2000.
Twenty years later, the Pandemic forced the Federal Reserve to cut the rates to the lowest point in history, providing an unprecedented economic stimulus and excess cash liquidity in the market. In turn, sectors like tech responded by rallying to a degree not seen since those times.

With the subsequent rise of interest rates earlier this month, the excess cash liquidity in the market had been lessened. With higher interest rates in safer investment vehicles such as bonds, investors have responded by taking cash out from equity markets.
Insight: Compared to March 2020, which was followed by extreme liquidity injections, we are now in a different landscape, where liquidity is being removed from the system.
In an environment where the number and depth of sellers outweigh the number and depth of buyers, naturally prices gravitate downwards. For any patient long term investors, this can provide opportunities to buy those high quality businesses they’ve been watching at lower prices, because those looking to sell their holdings will take any price they can in order to raise funds.
Market Outlook Next Week
The following week brings some key economic reports. These include:
- Euro Zone GDP report (May 17)
- US Retail Sales (May 17)
- China's Central Bank Rate Decision (May 20)
This data will give some direction regarding the future decisions of the policymakers, especially in Europe, as the European Central Bank has not yet hiked their interest rates.
Until next time,
Invest Well
Simply Wall St
Have feedback on this article? Concerned about the content? Get in touch with us directly. Alternatively, email editorial-team@simplywallst.com
Simply Wall St analyst Stjepan Kalinic and Simply Wall St have no position in any of the companies mentioned. This article is general in nature. We provide commentary based on historical data and analyst forecasts only using an unbiased methodology and our articles are not intended to be financial advice. It does not constitute a recommendation to buy or sell any stock and does not take account of your objectives, or your financial situation. We aim to bring you long-term focused analysis driven by fundamental data. Note that our analysis may not factor in the latest price-sensitive company announcements or qualitative material.

Stjepan Kalinic
Stjepan is a writer and an analyst covering equity markets. As a former multi-asset analyst, he prefers to look beyond the surface and uncover ideas that might not be on retail investors' radar. You can find his research all over the internet, including Simply Wall St News, Yahoo Finance, Benzinga, Vincent, and Barron's.

