Key Takeaways From The Q3 2023 Earnings Season

Reviewed by Bailey Pemberton, Michael Paige
“All intelligent investing is value investing, acquiring more than you are paying for. You must value the business in order to value the stock.” Charlie Munger
This week, we’re zooming in on how companies globally fared during the third quarter and what their results mean for the future and valuations. After that, we’re going to share how you can make the most of earnings forecasts to then build your own fair value estimate.
Like many investors, we were saddened to hear that Charlie Munger, Warren Buffett’s right-hand man passed away this week. His witty and funny “Mungerisms” have spread all over the world, and to us in the investing community, we’re incredibly grateful for his teachings 🙏
Later on, we cover one of Berkshire’s most successful investments, and it might not have happened without Charlie’s influence on Warren.
🎧 Would you prefer to listen to these insights? You can find the audio version on our Spotify or Apple podcasts !
Let’s dive in!
🔑 Key Takeaways From Earnings Season Around The World
Earnings season is just about over and results suggest the US earnings recession is over (for now anyway), while the rest of the world still has some way to go.
🇺🇸 USA - Earnings Growth On The Horizon
US company results for the third quarter were generally better than expected and continued to point to a recovery in earnings. The number of companies beating estimates was high, but the margin by which they beat was actually quite low.
According to Lipper Alpha Insights ( LSEG I/B/E/S ) companies in the S&P 500 index are on track to report year-on-year EPS growth of 7.1% on sales growth of 1.5%. EPS fell 2.8% in the second quarter, so this is a significant turnaround.
Although guidance for the fourth quarter was cautious, there were some positive takeaways from earnings calls. There were fewer mentions of recession and inflation than prior quarters, while AI remains the buzzword.
On the negative side, smaller companies are still experiencing an earnings recession, which is only expected to start improving in Q1 2024. Companies that missed estimates were also sold off aggressively.
Earnings are now expected to grow at 11.4% in 2024, and 11.8% in 2025. The consensus is that earnings will still be a little depressed for the current quarter, but will continue to improve throughout 2024.
🇪🇺 Europe - Recovery On The Way, But Not Quickly
As for European markets, they’re pointing to a bit of a slower recovery than the likes of the US.
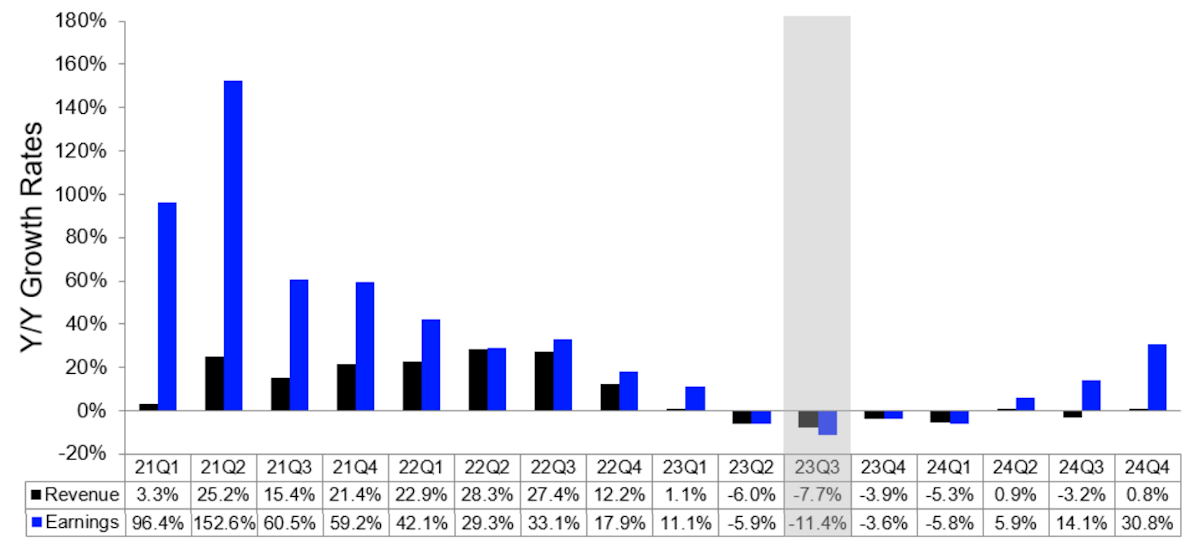
In Europe, only about half of the companies in the Euro Stoxx 600 Index have reported third-quarter results . By the time they have all reported earnings are expected to be about 11.4% lower year-on-year, while sales are expected to be 7.7% lower.
Future estimates suggest this earnings recession is expected to continue until the second quarter of 2024. However, the rate of decline is expected to slow during the current quarter and the first quarter of 2024.

🌏 Asia - Varies Widely Country By Country
In Asia sentiment during earnings season has been weaker, mostly due to China’s slowdown. Analysts have been cutting estimates for 2024, though the outlook varies pretty widely at the country and company level.
The overall outlook for Asia is actually very positive as Korea, Taiwan and Thailand are expected to stage a big recovery after sharp declines in profits this year.
The reality is still likely to depend on China which is the biggest trading partner for these economies, but as we mentioned recently, some emerging markets are beginning to rely less on China .
💡 The Insight: How To Make The Most Of Earnings Forecasts
Earnings forecasts are aggregate numbers compiled from the estimates for individual companies. We thought it would be worth mentioning where these estimates come from and how you can use and interpret them.
Consensus estimates are average which are compiled by companies like S&P Global, which is where Simply Wall St sources them. The individual estimates are made by analysts at research and brokerage firms, aka Wall Street. These analysts typically cover a handful of companies in a sector and provide research to fund management firms.
If you look at section 2 (Future Growth) of any company report on the Simply Wall St platform, you’ll see Earnings and Revenue Growth Forecasts (2.1) and Earnings per Share Growth Forecasts (2.3) which reflect the relevant trends. In both cases, you can click on the ‘Data’ tab at the bottom to see more details about these estimates.
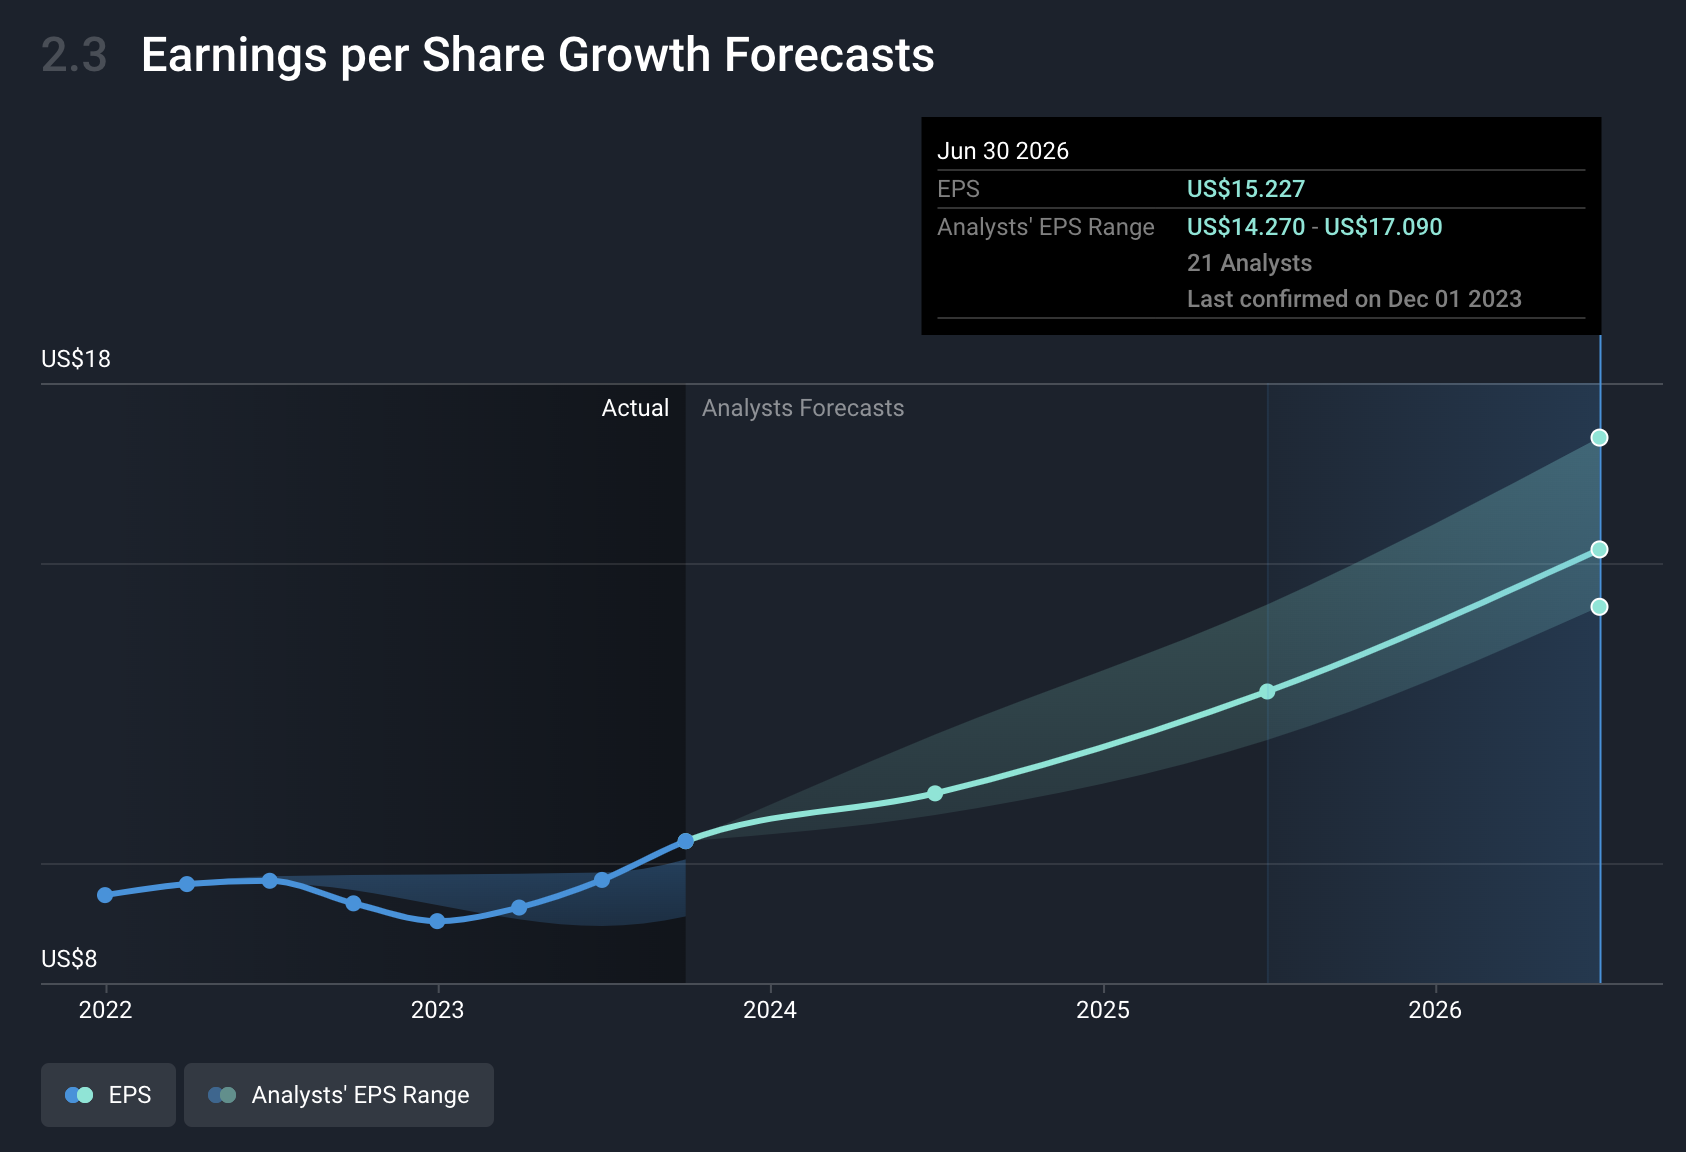
Below you can see the EPS data for Microsoft:

Looking at this table, we can see that there are 42 estimates for 2024 and 2025, and then 21 estimates for 2026. This is quite typical as many analysts only publish estimates for the next two years. The table also includes the high and low estimates, which gives you an indication of the consensus range - ie. how much agreement is there on the earnings outlook.
The consensus range and the number of analysts who publish estimates for years two and three is a good indication of how ‘predictable’ a company's future cash flows can be. If you look at smaller, more speculative companies you’ll often see a much bigger drop in the number of estimates for anything more than 1 year out.

Microsoft EPS Estimates - Simply Wall St
Something for investors to remember is that if a company is widely followed and the consensus range is narrow, it’s likely that these estimates will already be reflected in the share price.
Less consensus could mean more opportunity, but you obviously need to do your homework, which is where we come in!
Current Valuations And The Outlook Heading into 2024
Market pundits have divergent views (not unusual) on the outlook for 2024 and beyond. On the pessimistic side, JPMorgan Chase’s CEO Jamie Dimon still expects a recession .
In the middle is chief economic adviser of Allianz, Mohamed El-Erian, who believes there are still some serious headwinds to consider. He pointed out that the market’s rally over November was the result of a unique combination of four things happening at once:
- The data (inflation, growth, earnings) was promising,
- Oil prices are falling,
- Bond yields are falling, and
- There’s lots of cash on the sidelines.
He pointed out that inflation could rebound and OPEC may cut production again. Perhaps most importantly, the US needs to sell a lot of bonds which could lead to yields rising again. All of which he believes the market doesn’t appear to be accounting for.
Ken Fisher, founder of Fisher Investments, had a more optimistic take saying that the US is edging closer to a ‘ Goldilocks economy’ (not too hot, not too cold), with growth, inflation and employment all at reasonable levels.
Regardless of what you hear about market forecasts, remember the wise words from Buffett:
“Charlie [Munger] and I never have an opinion on the market because it wouldn’t be any good and it might interfere with the opinions we have that are good.”
He focuses on individual businesses and not what the markets may do, and we’d do well to do the same. Good companies are typically better equipped to handle tough market conditions.
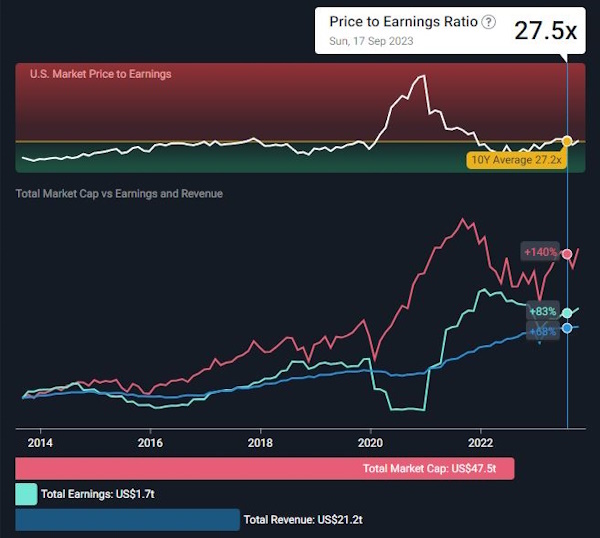
In light of the recent strong economic data over the last month, valuations have risen, but on average they aren’t necessarily stretched. The chart below shows the US market P/E ratio at 27.5x which is only just above its 10-year average:

The fact that valuations don’t appear stretched and there’s a lot of cash on the sidelines is a very promising sign.
Buuuut as we mentioned recently, there is a chance that inflation rebounds which means rates may go higher. That would put pressure on valuations and on the economy.
So we aren’t out of the woods, but things are looking a lot better than they were a few months ago. It’s best to position yourself in a way that has positive exposure to either outcome: You’ve got investments in high-quality stocks (that you believe are undervalued) where you benefit if markets continue to rally, and you’ve got cash ready to deploy should markets start retracing lower.
💡 The Insight: How To Use Fair Value Estimates
Market valuations give us an idea of the overall outlook and investor sentiment, BUT regardless of the valuation for the overall market, individual stocks could be fairly valued, overvalued, or undervalued.
We’ve covered earnings estimates, now let's have a look at how they are used to calculate an estimate of a company’s fair value.
If you look at the Simply Wall St company report for any company, you’ll see a fair value estimate under the valuation section (1.1).
So what exactly is a fair value estimate? Well, it’s not a price target and it’s not a recommendation either.
It’s an estimate of the fair value of a share based on the average of all the analyst earnings estimates for the company AND a few basic assumptions. This can give you an idea of how closely the market’s valuation matches an estimate based on consensus earnings forecasts from analysts.
A fair value estimate is useful to use as a starting point when you are working out what YOU think is the right price to pay for a stock.
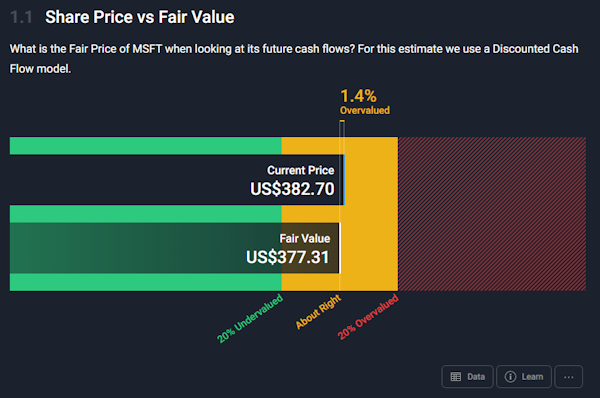
Below is the fair value estimate for Microsoft as of 29th November:

To give this estimate some context, you can click on the ‘Data’ tab. This will show you how the estimate is calculated and which assumptions are used.
Some of the key assumptions to consider are:
- The discount rate used to calculate the present value of future cash flows.
- This is made up of the risk-free rate and the equity risk premium.
- The earnings growth rate and how long earnings will continue to grow at that rate (years until decay).
- The perpetual growth rate , which is the growth rate after 10 years.
- When growth begins to decay it will decline until year 10 when it will be equal to the perpetual growth rate.
If you head over to the Stock Valuator you can experiment with these assumptions to see how they affect the valuation. You can also decide whether you agree with the assumptions that go into the estimate, and what YOU believe they should be.
To earn market-beating returns, you need to buy a stock when the market is underestimating the company’s future earnings potential.
If you start by understanding the market’s current valuation and what underlying expectations that current valuation implies investors are thinking (high growth, low growth, etc) you can then determine if you agree with the market, and what price you’d be willing to pay.
Does that current market price imply 20% earnings growth for a few years, but you think 30% is more likely? Then you’re more optimistic than the market and today’s stock price might look appealing to you.
Then you can develop a narrative to see whether you believe there are catalysts in place that can result in that growth.
What Else Is Happening?
First a recap of the key data release we mentioned last week…
- 🇺🇸 US GDP grew at 5.2% in the third quarter , according to the Commerce Department’s second estimate. The initial estimate was 4.9% and economists expected this estimate to be 5%, so this is very strong reading.
- This reading was the result of better-than-expected business investment and stronger government spending . Consumer spending was actually revised lower (from 4% to 3.6%) but still reflects reasonably strong growth. If inflation remains in a downward trend, this is very positive.
And then, one news item worth mentioning…
Rest in peace to Charlie Munger who passed away last week, a month before his 100th birthday.
Charlie Munger and Warren Buffett worked together for some 60 years and both became famous for their nuggets of investing wisdom, not to mention the returns they have earned.
Something you may not know is that Buffett credited Munger for changing his investment philosophy from buying fair companies at wonderful prices to buying wonderful companies at fair prices .
Prior to this, Buffett used the so-called cigar butt approach - buying shares that were significantly undervalued, regardless of the company. By doing this, he could make a profit when the share price reverted to its fair value. Sticking to the analogy, it’s like picking up a cigar butt that has one more puff in it. It’s a one-off event - you don’t own those kinds of stocks for long periods of time.
On the other hand, if you buy a wonderful company at a fair price, you get to benefit from decades of compounding, because you have trust in the company’s long-term growth .
Here’s a great example of this in action:
Berkshire Hathaway started buying Coca-Cola in 1988 at the split-adjusted equivalent of $2.73 and accumulated about $1.3bn worth of stock. It’s now trading at $58 and pays a dividend of $1.80. Whatever Buffett and Munger thought the fair value was at the time, most of the gains have come since that level was reached.
If it was an average company and they got it at a 50% discount, they might have doubled their money and moved on. Instead, they have made 20 times their initial investment, plus dividends - which nowadays amounts to about $730 million PER year. Put another way, he’s being repaid 66-ish% of his original cost-base every year, and that’s not even including the prior 35 years of payments.

In October, Munger was on a podcast for the first time ever. He was interviewed on the Acquired Podcast , which has also done some good, very deep dives into listed companies like Lockheed Martin, Costco, Nike, NVIDIA and many more which we highly recommend.
If you’re interested in hearing some other interesting perspectives on the likes of Nike and Nvidia, be sure to check out some of our latest Narratives!
Key Events During The Next Week
This is a big week for data in Australia with the interest rate decision on Tuesday, GDP data on Wednesday, and trade data on Thursday.
In the US it's ‘jobs week’ starting with the JOLTs Job Openings report on Tuesday, the ADP employment report on Wednesday and the unemployment rate and non-farm payrolls on Friday.
Elsewhere, we have China’s trade balance out on Thursday and Japan’s GDP growth rate on Friday.
Earnings season is all but over, but there are still a few companies due to report, including:
Have feedback on this article? Concerned about the content? Get in touch with us directly. Alternatively, email editorial-team@simplywallst.com
Simply Wall St analyst Richard Bowman and Simply Wall St have no position in any of the companies mentioned. This article is general in nature. We provide commentary based on historical data and analyst forecasts only using an unbiased methodology and our articles are not intended to be financial advice. It does not constitute a recommendation to buy or sell any stock and does not take account of your objectives, or your financial situation. We aim to bring you long-term focused analysis driven by fundamental data. Note that our analysis may not factor in the latest price-sensitive company announcements or qualitative material.

Richard Bowman
Richard is an analyst, writer and investor based in Cape Town, South Africa. He has written for several online investment publications and continues to do so. Richard is fascinated by economics, financial markets and behavioral finance. He is also passionate about tools and content that make investing accessible to everyone.

