Quote of the Week: "The individual investor should act consistently as an investor and not as a speculator." — Ben Graham
Can you believe the first quarter of 2024 is already behind us?
The global economy and markets are in better shape than many predicted. Equity markets have continued higher, with several indexes reaching record levels, despite increased geopolitical risks and interest rates remaining at 20-year highs.
Is the market being complacent about the risks, or do the opportunities outweigh them?
This week, it seems fitting to recap the quarter, with a look back at earnings season and a look forward at the outlook for the second quarter.
Let’s dive in!
What Happened in Markets this Week?
Here’s a quick summary of what’s been going on:
- 🚗 BYD pips Tesla on quarterly revenue, but margins decline ( Fortune )
- Our take : BYD earned $25.36 billion in Q4 2023, just $200 million more than Tesla. Despite reporting record deliveries and revenue, BYD’s profits fell as the EV price war took its toll. The company also seems to be losing market share to Huawei-backed Aito which has seen rapid growth in demand in the last year. BYD’s plans for the US are also shaping up to be a geopolitical football: China has filed a complaint with the WTO over US subsidies for EVs, while Donald Trump is proposing a 100% tariff on Mexico-built Chinese vehicle imports.
- 📱 Apple iPhone shipments in China fell 33% in February ( Business Insider )
- Our take: The DOJ’s antitrust case against Apple could take years to play out, but slowing iPhone sales, in China and elsewhere, are an immediate problem for the company. Apple is a cash cow, but it’s hard to see where the growth comes from in the next few years.
- 📈 Trump Media & Technology Group doubles in two days ( FT )
- Our take: After two days trading under the ‘DJT’ ticker, the company had a market cap approaching $10 billion. Truth Social, DJT’s primary asset, reportedly has around 5 million users and brought in $3 million in revenue in 2023. If those numbers are correct, the company is trading at ~3,300x sales or $2,000 per user. For reference, Meta is trading at 9x sales and ~$400 per user.
And some of the key economic data released recently:
-
🇬🇧 UK Q4 GDP declined 0.3% for the 4th quarter, in line with forecasts.
- This was driven by a decrease in net trade and household consumption, and was a larger decline than the 0.1% in the prior quarter
-
🇦🇺 In Australia the Westpac Consumer Confidence Index fell by 1.8% .
- This was slightly more than the forecasts of a 1.6% decline.
- The index is just above the lowest levels of the last year, but interest rates are still weighing on consumer sentiment in Australia.
-
🇺🇲 US Durable goods orders rose 1.4% in February
- This was better than expected as the economy continued to surprise to the upside.
-
🇺🇸 US GDP in Q4 grew at 3.4% (annualized), higher than the 3.2% estimate.
- This was reportedly driven by higher consumer spending and high exports.
- This was reportedly driven by higher consumer spending and high exports.
Quarterly Market Review
2024 got off to a strong start for global equity markets as the soft landing narrative became increasingly talked about.
While interest rates haven’t started falling yet, investors seem to be confident that they aren’t going higher - which seems to be good enough for market valuations.
The approximate year-to-date returns for major markets as of 28th March were:
| Market | YTD Returns |
| 🇺🇸 US | 9% |
| 🇬🇧 UK | 1.4% |
| 🇩🇪 Germany | 6.8% |
| 🇨🇦 Canada | 5% |
| 🇦🇺 Australia | 3.3% |
| 🇰🇷 South Korea | 3.3% |
| 🇯🇵 Japan | 15.8% |
| 🇮🇳 India | 4.4% |
| 🇨🇳 China | -2.4% |
✨ For most markets, the technology and financial sectors contributed to stronger performance, while materials, utilities and energy acted as a drag on performance.
The relative weighting of these sectors explains most of the performance. China’s stock market continues to underperform, although it has recovered from its worst levels.
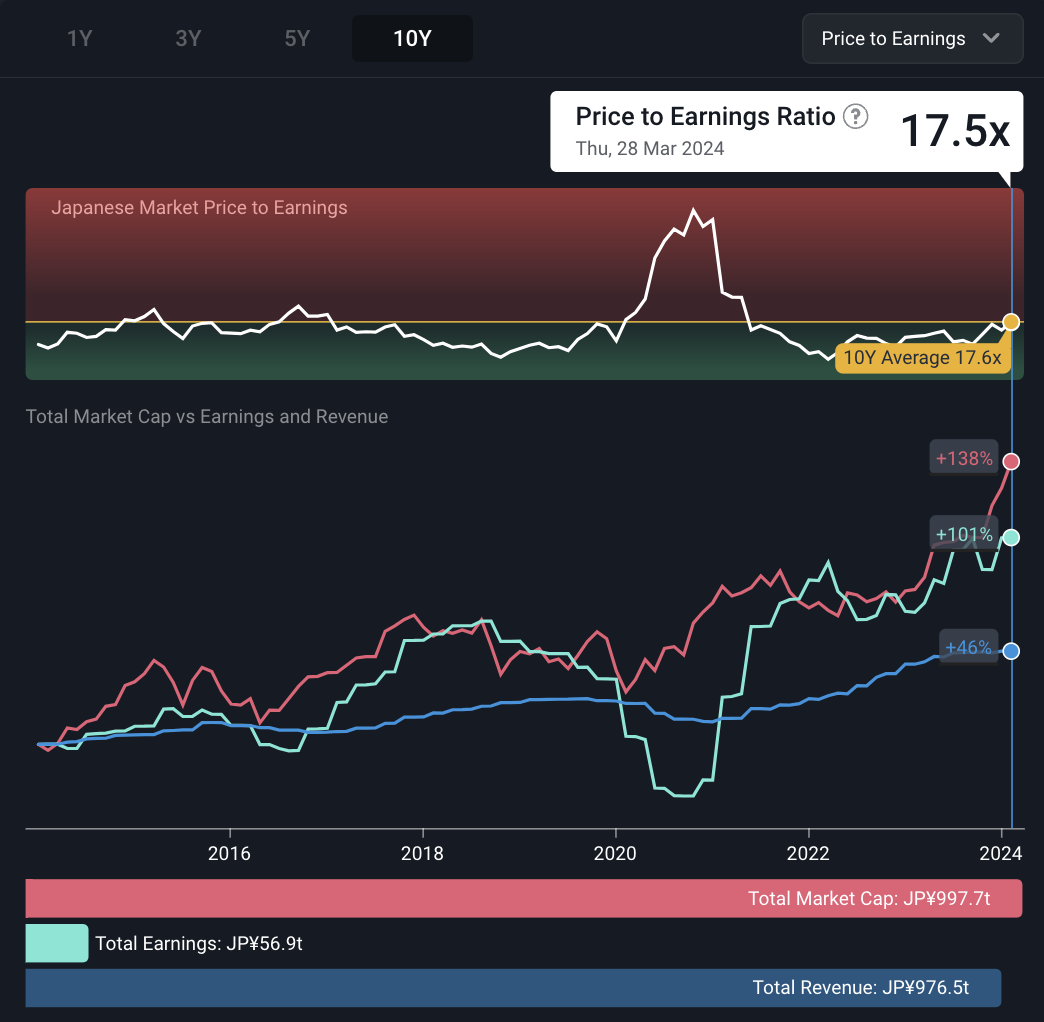
The top-performing major market was Japan, which benefited from strong corporate earnings as well as a weakening currency as the Yen fell to a 34-year low (a weaker currency helps to boost exports).
The chart below (from the Simply Wall St Markets page ) suggests that Japanese equities are still trading close to the 10-year average P/E multiple. The BOJ hasn’t ruled out intervening to support the currency, so that might be a risk to this rally.
What Did We Learn From Earnings Season?
For companies in the S&P 500 index, the rebound in earnings growth that began in the third quarter of 2023 continued in the fourth quarter.
Factset published a comprehensive breakdown of earnings season for companies in the S&P 500 index. Here are 7 takeaways that stood out to us:
- Q4 Earnings were 4.1% higher year-on-year.
- This was substantially higher than the 1.5% growth rate expected on 31st December.
- Q4 Revenue was also 4.1% higher
- This was only slightly higher than the 3.1% expected in December.
- Q4 earnings were much lower than Q3, but revenue was much higher
- ✨ This implies that the earnings recession initially ended due to cost-cutting, but was driven by sales growth in the fourth quarter.
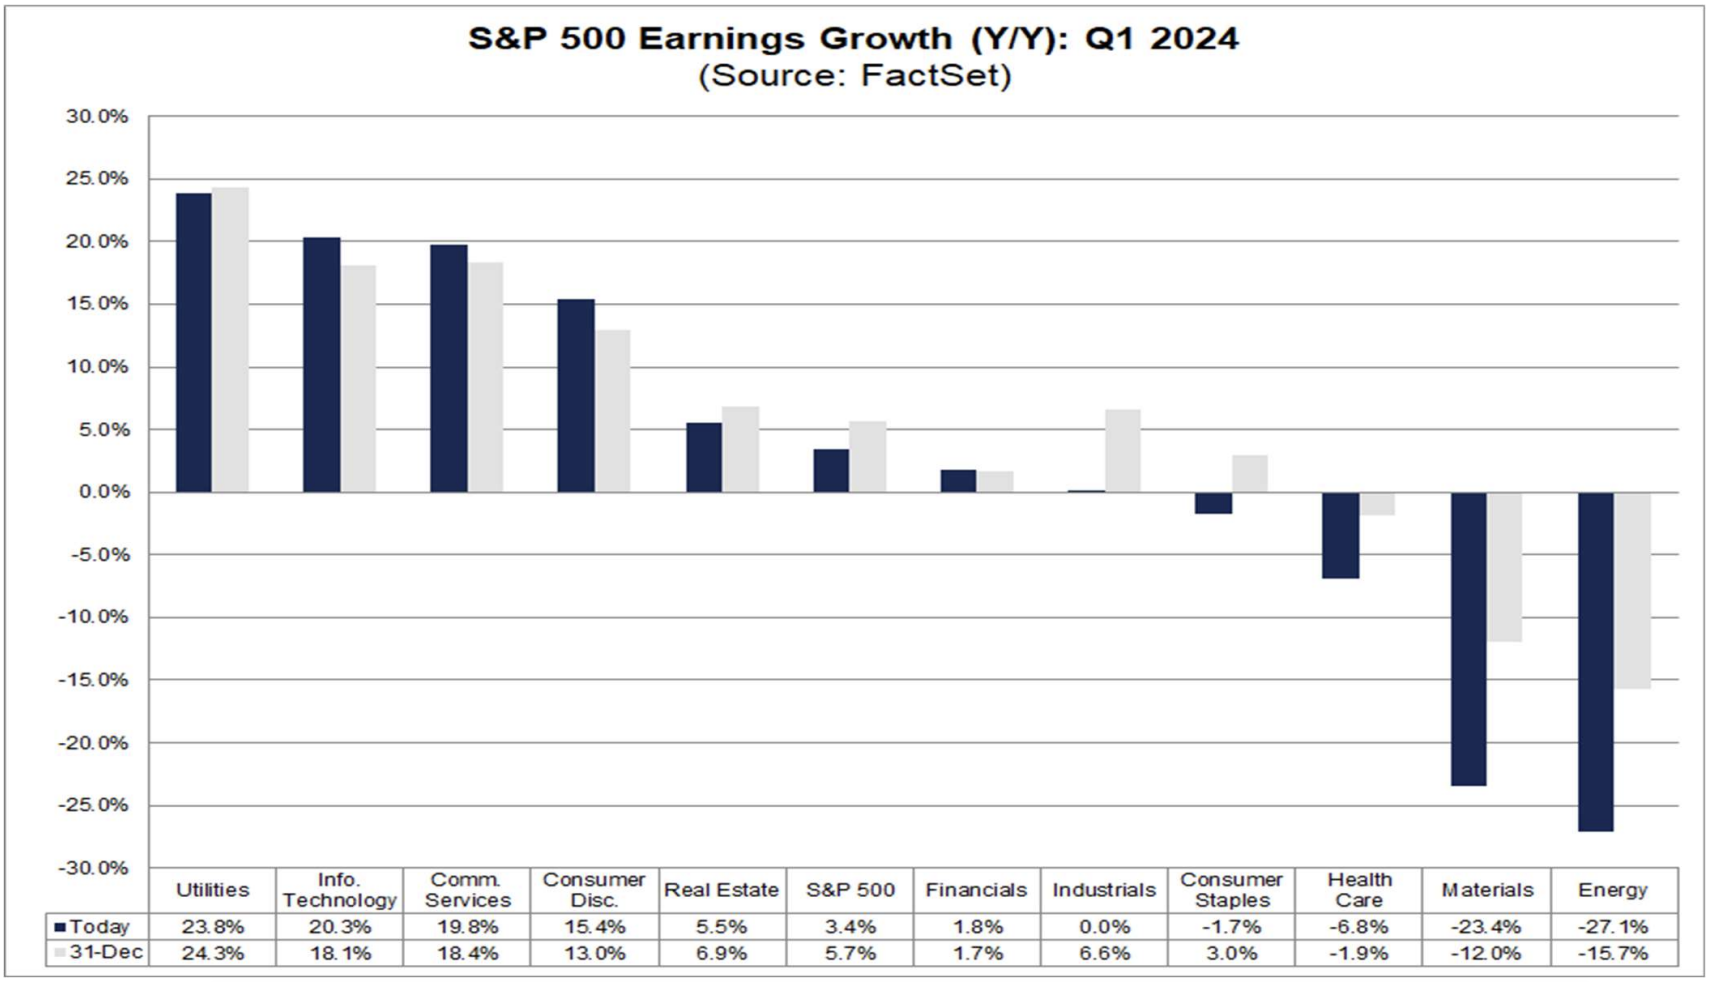
- There were four sectors that reported earnings growth of 20%, and they were:
- Communication services,
- Consumer discretionary,
- Technology and
- Utilities.
- Meanwhile, there were four sectors with earnings that fell 10% or more, and they were:
- Financials,
- Healthcare,
- Materials and
- Energy.
- At least 73 S&P 500 companies issued negative guidance for the current (first) quarter, which is substantially higher than average .
- Estimates for Q1 earnings and revenue growth have been reduced
- Earnings growth estimates for Q1 fell from 5.7% to 3.4%, while revenue growth estimates fell from 4.3% to 3.6%. The sectors with the biggest downward revisions were:
- Healthcare,
- Materials and
- Energy.
- Earnings growth estimates for Q1 fell from 5.7% to 3.4%, while revenue growth estimates fell from 4.3% to 3.6%. The sectors with the biggest downward revisions were:
✨ While analysts have lowered their estimates for Q1, they are still upbeat about the full year. This isn’t surprising as recession fears have faded, and the inflation outlook has improved.
US large caps have led equity markets since the 2022 low, and this earnings season backed up that outperformance. Earnings for smaller US companies and companies in other markets weren’t nearly as impressive.
According to Lipper Alpha Insights, companies in the Russell 2000 index reported a 1.4% year-on-year decrease in revenue , with earnings down as much as 20%.
Earnings were lower for all sectors apart from technology, industrials, and real estate .
Similarly, in Europe, listed companies are still under pressure.
Companies in the STOXX Europe 600 index reported a 6.5% decrease in earnings on revenue that was 5% lower . Most of the declines can be attributed to the energy sector, however, even when that sector is excluded, earnings and revenue were still 1.3% and 1.8% lower respectively.
Interest Rates And Inflation
Inflation in most countries is still higher than the targets set by central banks. It’s also falling very slowly now after the rapid declines in the first half of 2023. But it hasn’t rebounded as many feared - well, at least not yet anyway.
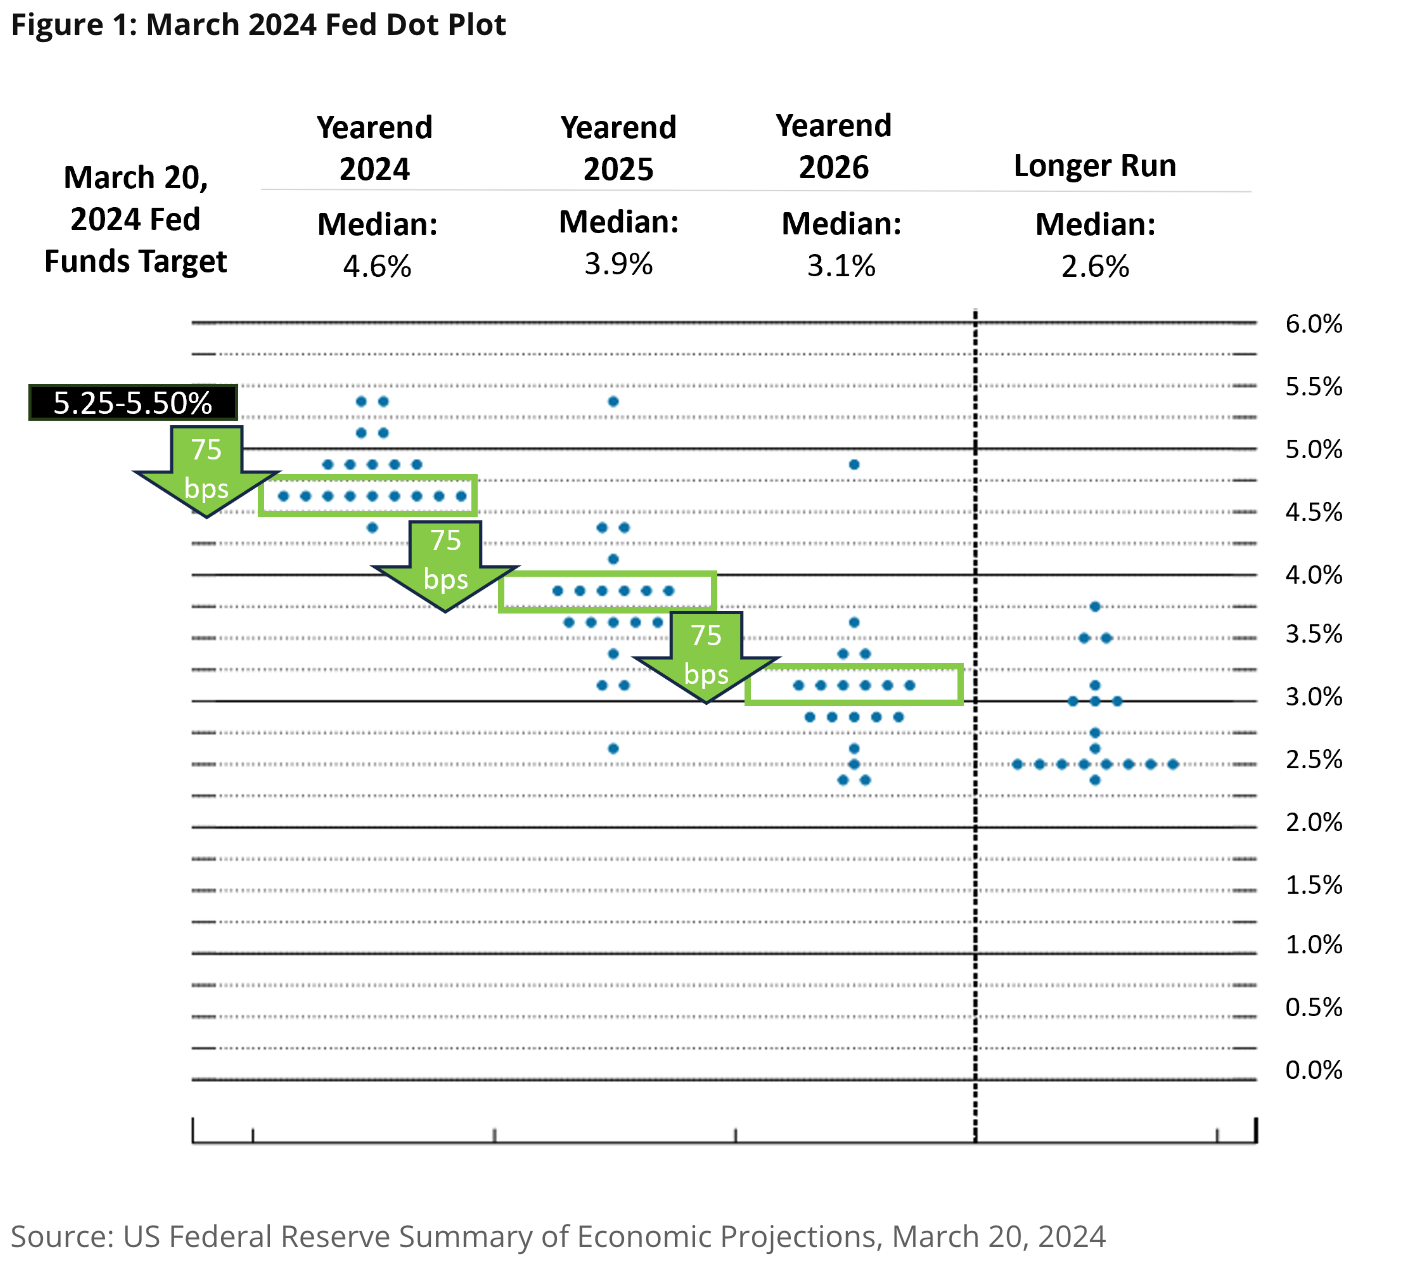
The US Fed’s latest ‘dot plot’ implies about 0.75% in rate cuts each year in 2024, 2025 and 2026.
Each blue dot in the chart represents the year-end forecast from each member of the monetary policy committee. There’s quite a lot of consensus, but there are still a few outliers who see rates remaining at substantially higher levels.
In February, we covered Howard Mark’s Easy Money memo which pointed out that the current Fed Funds rate of 5.25% would have been about average before we entered the ZIRP (zero interest rate policy) era.
✨ The projections above are a little lower, but still much higher than the rates we’ve seen in the last decade. However, if inflation rebounds, rates will certainly be at the upper end of that range, at least.
Valuations and the Outlook for The Second Quarter
By most measures, valuations are slightly higher than their historical averages, but they don’t appear to be excessive. Earnings estimates for the first quarter have already been trimmed, so expectations shouldn't be too high either.
The economic outlook also has the characteristics of a ‘ Goldilocks economy’: ie. not too hot and not too cold.
On the whole, the outlook is more upbeat than it’s been in a while, with several obvious risks, most notably the geopolitical risks we highlighted recently , and the chance that inflation rebounds.
💡 The Insight: Do A Quarterly Portfolio Check-in
Every quarter, it can be a great time to review your holdings in your portfolio given each business will likely have produced new and updated figures on how it is going (at least in the US where companies report quarterly).
With this new information, it’s then crucial to make sure your holdings match your expectations for the future.
Go through each stock individually, and ask yourself these questions:
- What is my narrative for owning this stock?
- What is my estimated fair value for this stock, and how did I get there?
- Given the latest information, is my narrative on track and playing out as I expected?
- If not, what new information has come to light that changes my assumptions for better or worse?
- If my narrative has now been adjusted, does my fair value estimate need updating as well?
Doing this essentially gives you a pulse check on your portfolio, making sure you’re up to date on what you own, and WHY you own it.
In the Watchlist and Portfolio sections on the platform, you can assign a fair value estimate to every stock, either creating your own, using the SWS estimate or the analyst price target, if there are any.
When you review your portfolio or watchlist you’ll then see how undervalued or overvalued a business is relative to your estimates.
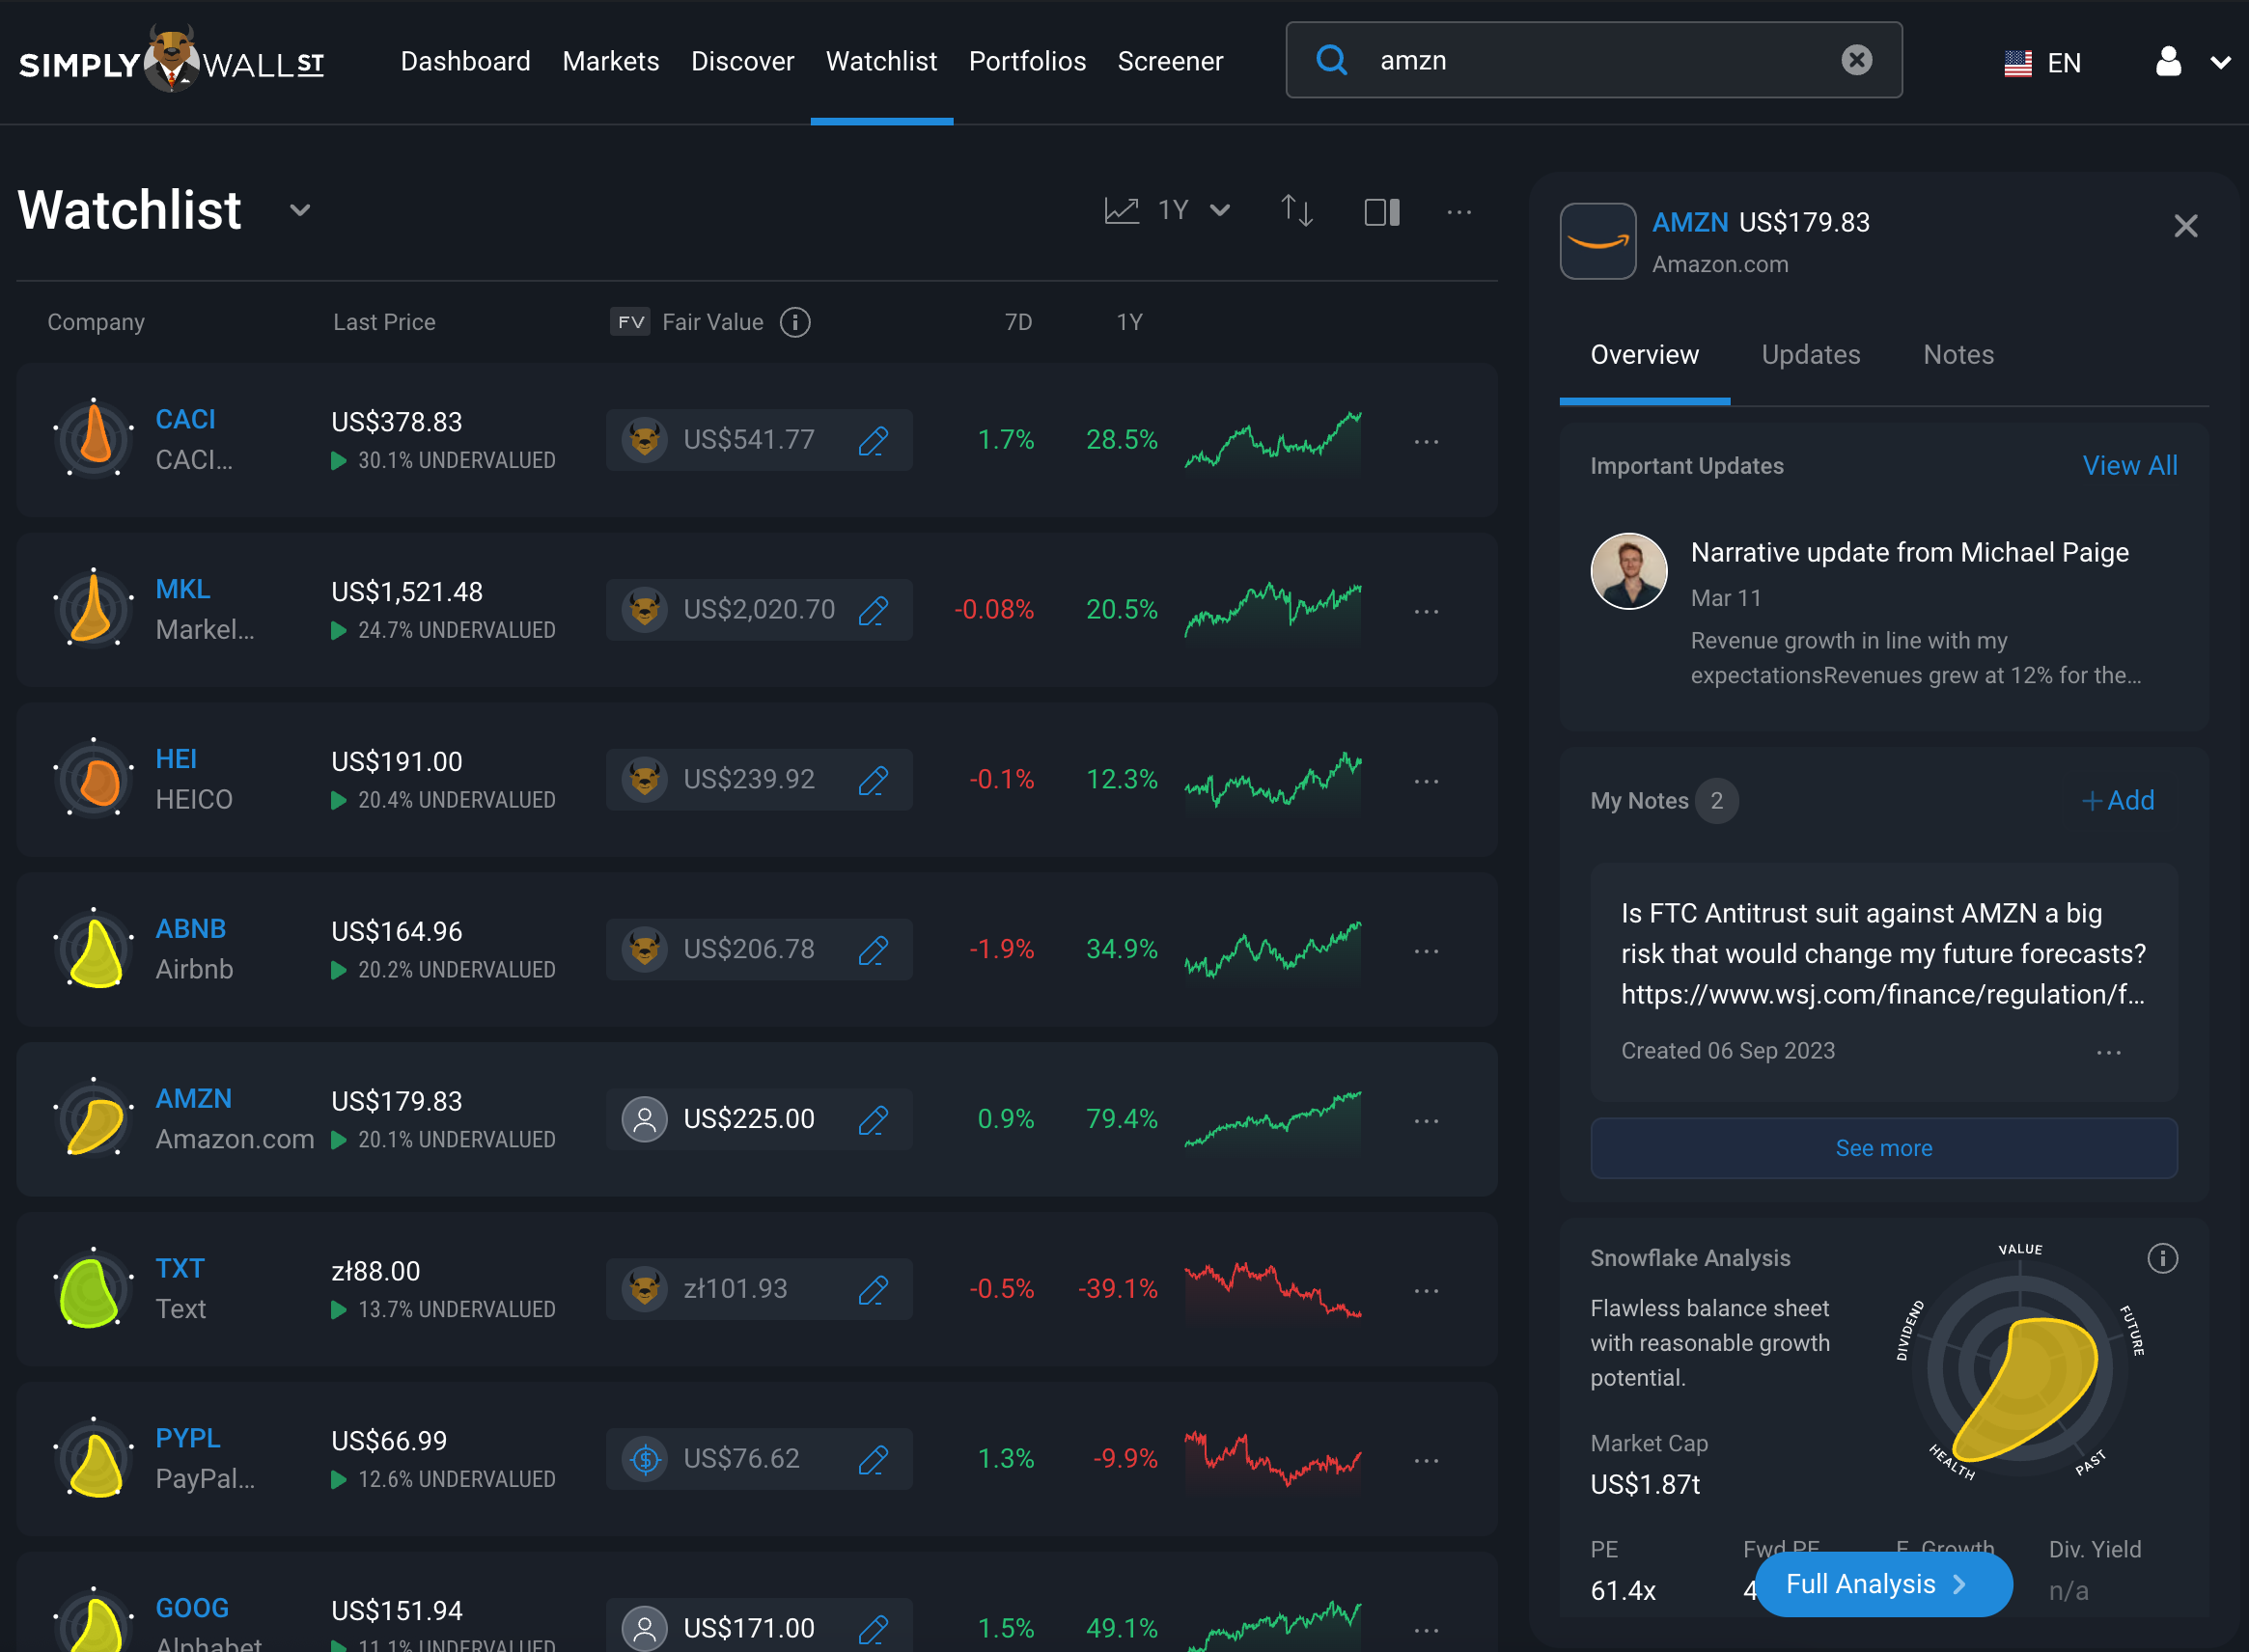
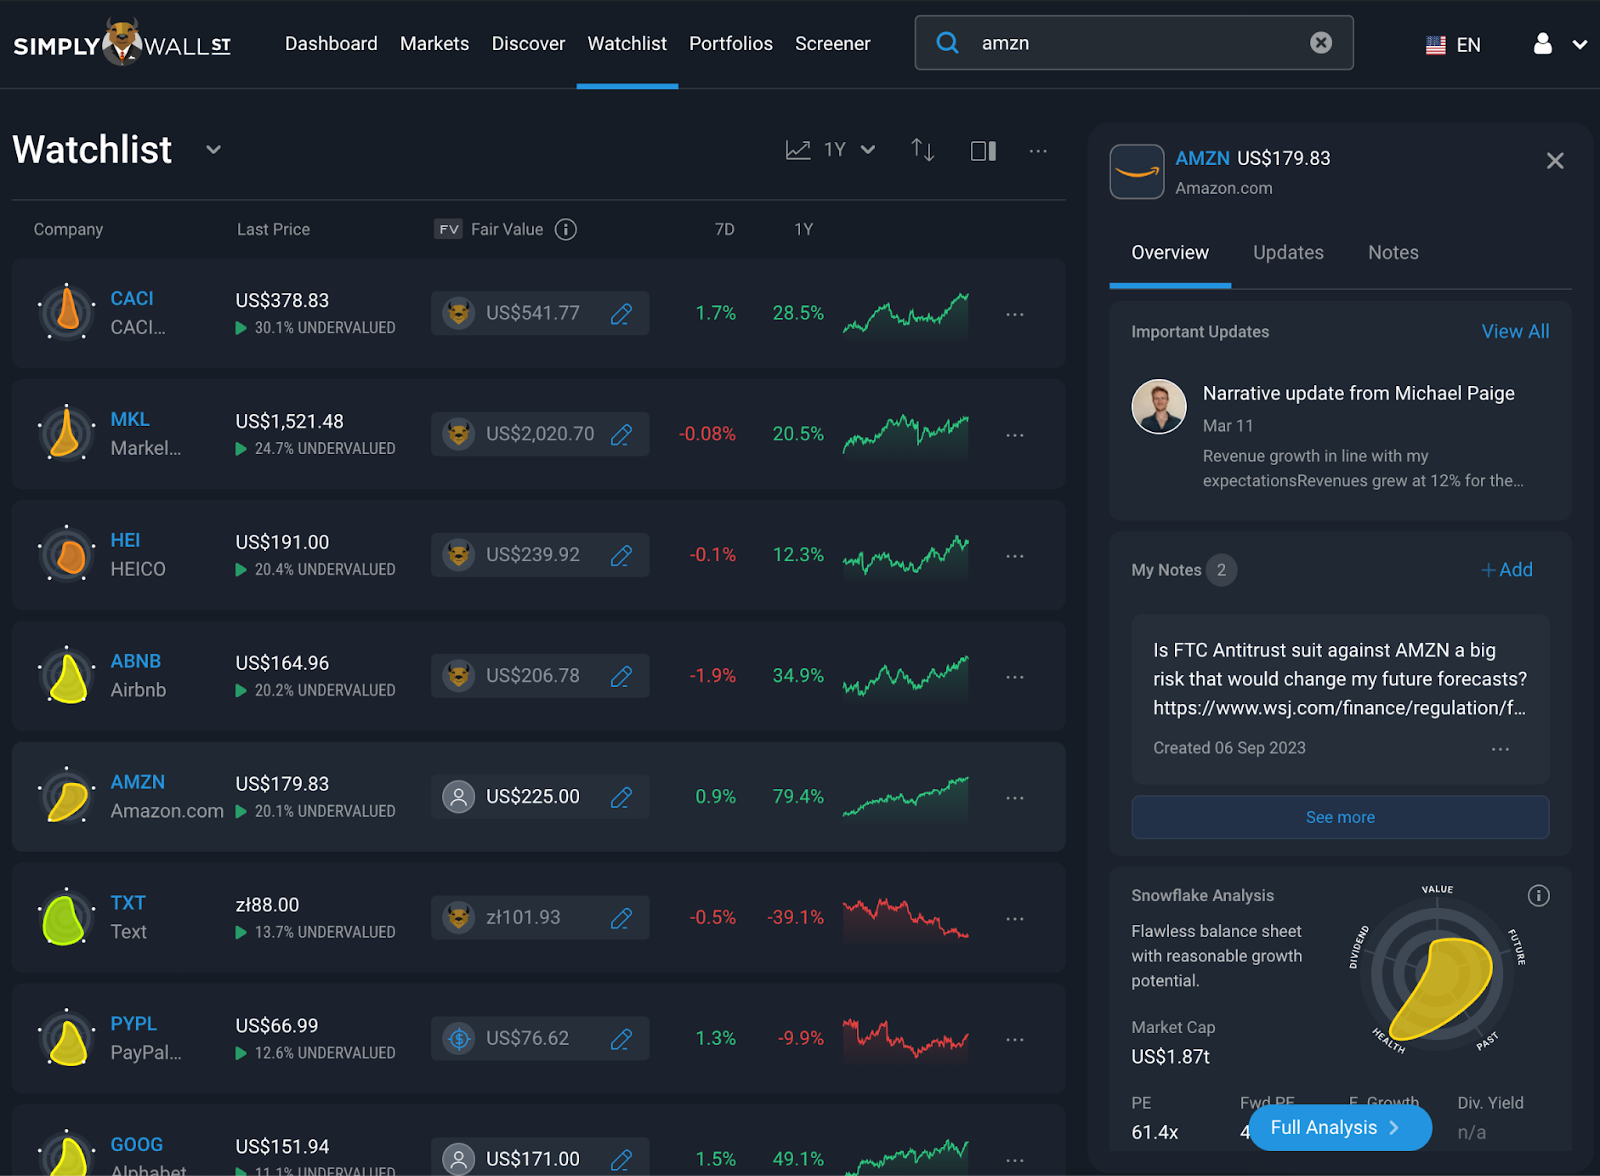
On the narrative front, you can currently store your narrative in the My Notes section on any stock and you can view other investors narratives on the platform for some of the biggest US-listed companies like Amazon .
Keep your eyes peeled because soon we’ll be releasing a beta experience for creating and maintaining your own narratives on the platform.
Key Events During the Next Week
Tuesday
- 🇦🇺 The Reserve Bank of Australia will publish the minutes from the recent interest rate meeting.
- 🇺🇸 US Jolts Job Openings are forecast to fall very slightly to 8.84 million.
Wednesday
- 🇺🇸 The US ADP National Employment Report is expected to show 125k new jobs, down slightly from the previous figure of 140k.
Thursday
- 🇨🇦 Trade data is due in Canada, where the prior surplus was $500 million, and forecasted to be the same.
Friday
-
🇦🇺 Australia’s trade data is due, with the trade surplus expected to fall from A$11.03 billion to A$9.9 billion.
-
🇨🇦Canada’s unemployment rate (currently 5.8%) will be published, with expectations for it to remain the same.
-
🇺🇸 US employment data is also due. The unemployment rate is forecast to remain unchanged at 3.9% while non-farm payrolls are expected to fall to 100k from 223k.
There are lots of small caps and OTC companies reporting this week. The only 2 larger US companies due to report are:
Have feedback on this article? Concerned about the content? Get in touch with us directly. Alternatively, email editorial-team@simplywallst.com
Simply Wall St analyst Richard Bowman and Simply Wall St have no position in any of the companies mentioned. This article is general in nature. We provide commentary based on historical data and analyst forecasts only using an unbiased methodology and our articles are not intended to be financial advice. It does not constitute a recommendation to buy or sell any stock and does not take account of your objectives, or your financial situation. We aim to bring you long-term focused analysis driven by fundamental data. Note that our analysis may not factor in the latest price-sensitive company announcements or qualitative material.

Richard Bowman
Richard is an analyst, writer and investor based in Cape Town, South Africa. He has written for several online investment publications and continues to do so. Richard is fascinated by economics, financial markets and behavioral finance. He is also passionate about tools and content that make investing accessible to everyone.