
Advertisement
Earnings growth outpaced the notable 76% return delivered to Telkom SA SOC (JSE:TKG) shareholders over the last year
Passive investing in index funds can generate returns that roughly match the overall market. But investors can boost returns by picking market-beating companies to own shares in. For example, the Telkom SA SOC Ltd (JSE:TKG) share price is up 67% in the last 1 year, clearly besting the market return of around 23% (not including dividends). If it can keep that out-performance up over the long term, investors will do very well! It is also impressive that the stock is up 59% over three years, adding to the sense that it is a real winner.
Since the stock has added R1.9b to its market cap in the past week alone, let's see if underlying performance has been driving long-term returns.
While markets are a powerful pricing mechanism, share prices reflect investor sentiment, not just underlying business performance. One flawed but reasonable way to assess how sentiment around a company has changed is to compare the earnings per share (EPS) with the share price.
Telkom SA SOC was able to grow EPS by 132% in the last twelve months. It's fair to say that the share price gain of 67% did not keep pace with the EPS growth. Therefore, it seems the market isn't as excited about Telkom SA SOC as it was before. This could be an opportunity. The caution is also evident in the lowish P/E ratio of 7.58.
You can see how EPS has changed over time in the image below (click on the chart to see the exact values).
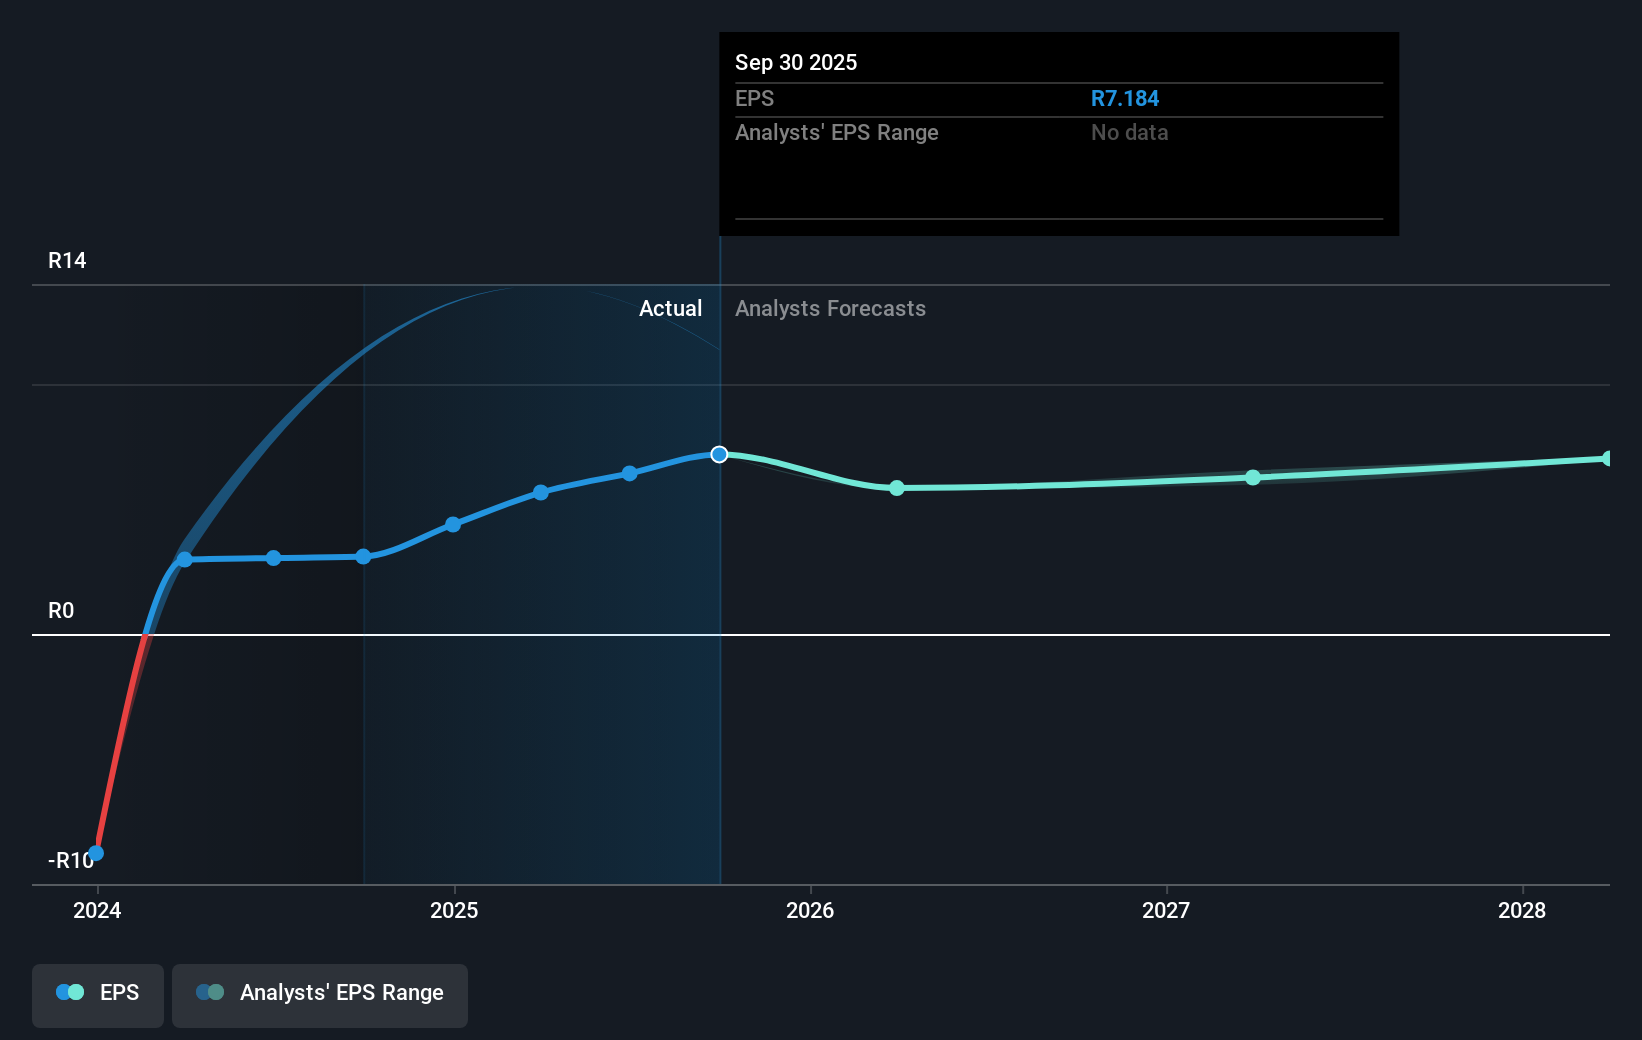
We know that Telkom SA SOC has improved its bottom line lately, but is it going to grow revenue? This free report showing analyst revenue forecasts should help you figure out if the EPS growth can be sustained.
What About Dividends?
It is important to consider the total shareholder return, as well as the share price return, for any given stock. Whereas the share price return only reflects the change in the share price, the TSR includes the value of dividends (assuming they were reinvested) and the benefit of any discounted capital raising or spin-off. It's fair to say that the TSR gives a more complete picture for stocks that pay a dividend. As it happens, Telkom SA SOC's TSR for the last 1 year was 76%, which exceeds the share price return mentioned earlier. And there's no prize for guessing that the dividend payments largely explain the divergence!
A Different Perspective
It's nice to see that Telkom SA SOC shareholders have received a total shareholder return of 76% over the last year. And that does include the dividend. That gain is better than the annual TSR over five years, which is 11%. Therefore it seems like sentiment around the company has been positive lately. Someone with an optimistic perspective could view the recent improvement in TSR as indicating that the business itself is getting better with time. It's always interesting to track share price performance over the longer term. But to understand Telkom SA SOC better, we need to consider many other factors. Consider for instance, the ever-present spectre of investment risk. We've identified 1 warning sign with Telkom SA SOC , and understanding them should be part of your investment process.
We will like Telkom SA SOC better if we see some big insider buys. While we wait, check out this free list of undervalued stocks (mostly small caps) with considerable, recent, insider buying.
Please note, the market returns quoted in this article reflect the market weighted average returns of stocks that currently trade on South African exchanges.
Valuation is complex, but we're here to simplify it.
Discover if Telkom SA SOC might be undervalued or overvalued with our detailed analysis, featuring fair value estimates, potential risks, dividends, insider trades, and its financial condition.
Access Free AnalysisHave feedback on this article? Concerned about the content? Get in touch with us directly. Alternatively, email editorial-team (at) simplywallst.com.
This article by Simply Wall St is general in nature. We provide commentary based on historical data and analyst forecasts only using an unbiased methodology and our articles are not intended to be financial advice. It does not constitute a recommendation to buy or sell any stock, and does not take account of your objectives, or your financial situation. We aim to bring you long-term focused analysis driven by fundamental data. Note that our analysis may not factor in the latest price-sensitive company announcements or qualitative material. Simply Wall St has no position in any stocks mentioned.
About JSE:TKG
Telkom SA SOC
Operates as an integrated communications and information technology (IT) services provider in South Africa, the United States, the United Kingdom, rest of Europe, and internationally.
Flawless balance sheet and undervalued.
Similar Companies
Market Insights

Advertisement
Community Narratives
MicroVision will explode future revenue by 380.37% with a vision towards success
Fair Value US$60.00|98.5% undervalued
TH
Community Contributor
The Indispensable Artery for a New North American Economy
Fair Value CA$132.87|2.3% undervalued
TI
Community Contributor