Stock Analysis
- South Africa
- /
- Metals and Mining
- /
- JSE:ARI
African Rainbow Minerals' (JSE:ARI) three-year decline in earnings translates into losses for shareholders

It's nice to see the African Rainbow Minerals Limited (JSE:ARI) share price up 11% in a week. But that cannot eclipse the less-than-impressive returns over the last three years. Truth be told the share price declined 34% in three years and that return, Dear Reader, falls short of what you could have got from passive investing with an index fund.
Although the past week has been more reassuring for shareholders, they're still in the red over the last three years, so let's see if the underlying business has been responsible for the decline.
See our latest analysis for African Rainbow Minerals
To paraphrase Benjamin Graham: Over the short term the market is a voting machine, but over the long term it's a weighing machine. One flawed but reasonable way to assess how sentiment around a company has changed is to compare the earnings per share (EPS) with the share price.
During the three years that the share price fell, African Rainbow Minerals' earnings per share (EPS) dropped by 10% each year. The share price decline of 13% is actually steeper than the EPS slippage. So it's likely that the EPS decline has disappointed the market, leaving investors hesitant to buy. The less favorable sentiment is reflected in its current P/E ratio of 7.56.
You can see how EPS has changed over time in the image below (click on the chart to see the exact values).
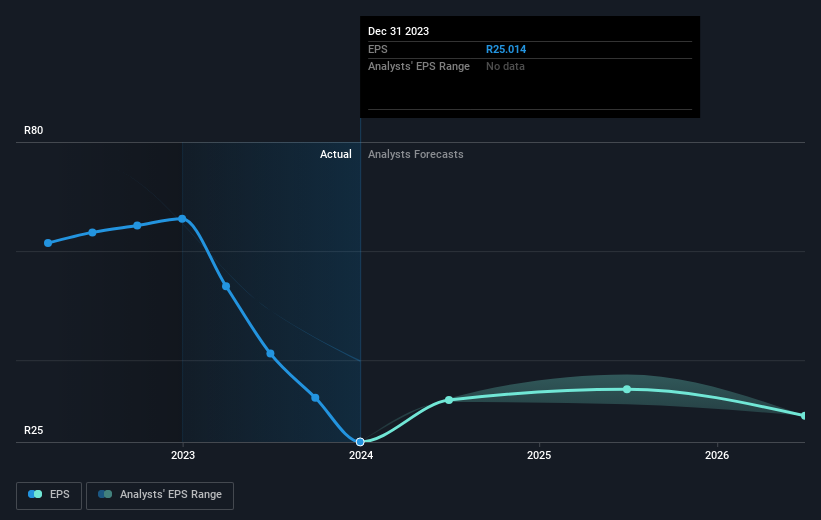
It might be well worthwhile taking a look at our free report on African Rainbow Minerals' earnings, revenue and cash flow.
What About Dividends?
When looking at investment returns, it is important to consider the difference between total shareholder return (TSR) and share price return. The TSR incorporates the value of any spin-offs or discounted capital raisings, along with any dividends, based on the assumption that the dividends are reinvested. Arguably, the TSR gives a more comprehensive picture of the return generated by a stock. We note that for African Rainbow Minerals the TSR over the last 3 years was -1.2%, which is better than the share price return mentioned above. This is largely a result of its dividend payments!
A Different Perspective
While the broader market gained around 1.8% in the last year, African Rainbow Minerals shareholders lost 12% (even including dividends). Even the share prices of good stocks drop sometimes, but we want to see improvements in the fundamental metrics of a business, before getting too interested. Longer term investors wouldn't be so upset, since they would have made 16%, each year, over five years. It could be that the recent sell-off is an opportunity, so it may be worth checking the fundamental data for signs of a long term growth trend. It's always interesting to track share price performance over the longer term. But to understand African Rainbow Minerals better, we need to consider many other factors. Even so, be aware that African Rainbow Minerals is showing 2 warning signs in our investment analysis , and 1 of those makes us a bit uncomfortable...
If you would prefer to check out another company -- one with potentially superior financials -- then do not miss this free list of companies that have proven they can grow earnings.
Please note, the market returns quoted in this article reflect the market weighted average returns of stocks that currently trade on South African exchanges.
Valuation is complex, but we're helping make it simple.
Find out whether African Rainbow Minerals is potentially over or undervalued by checking out our comprehensive analysis, which includes fair value estimates, risks and warnings, dividends, insider transactions and financial health.
View the Free AnalysisHave feedback on this article? Concerned about the content? Get in touch with us directly. Alternatively, email editorial-team (at) simplywallst.com.
This article by Simply Wall St is general in nature. We provide commentary based on historical data and analyst forecasts only using an unbiased methodology and our articles are not intended to be financial advice. It does not constitute a recommendation to buy or sell any stock, and does not take account of your objectives, or your financial situation. We aim to bring you long-term focused analysis driven by fundamental data. Note that our analysis may not factor in the latest price-sensitive company announcements or qualitative material. Simply Wall St has no position in any stocks mentioned.
About JSE:ARI
African Rainbow Minerals
African Rainbow Minerals Limited, through its subsidiaries, operates as a diversified mining and minerals company in South Africa and Malaysia.
Flawless balance sheet average dividend payer.
