Advertisement
- United States
- /
- Electric Utilities
- /
- NYSE:SO
Is There Still Value in Southern After 13% Price Surge and Renewable Expansion News?

Simply Wall St
Reviewed by Bailey Pemberton
- Wondering if Southern's stock might be a hidden gem or already priced for perfection? Let’s cut through the noise for anyone eager to know if there's real value left to tap.
- After a strong 13.0% jump this year and a nearly 75% climb over the last 5 years, Southern’s share price is sending signals that growth and risk perceptions are shifting quickly.
- Recent headlines have highlighted Southern’s ambitious push into renewable infrastructure along with fresh regulatory updates, both of which have fueled investor interest and may be contributing to these price changes. The company’s expansion plans and government support have become talking points extending well beyond the energy sector.
- When it comes to value, Southern scores a 4 out of 6 on our valuation checks, suggesting some aspects look attractively priced. In the next section, we’ll break down how different valuation methods compare for Southern, and later on, provide a broader perspective to see if the stock truly stands out.
Find out why Southern's 8.0% return over the last year is lagging behind its peers.
Approach 1: Southern Discounted Cash Flow (DCF) Analysis
The Discounted Cash Flow (DCF) model estimates a company’s value by extrapolating its future cash flows and discounting them back to reflect what they are worth today. This approach lets investors gauge what a business may be worth independently of market hype or short-term sentiment.
For Southern, the analysis starts with last year’s Free Cash Flow, which came in at minus $1.01 Billion. Looking ahead, analyst estimates put 2027 Free Cash Flow at approximately $2.1 Billion, suggesting a dramatic growth trajectory. After 2027, cash flow projections are extended by Simply Wall St and reach an estimated $19.29 Billion by 2035. Most of these future values come from internal modeling rather than actual street analyst estimates, so they should be viewed as educated forecasts beyond five years.
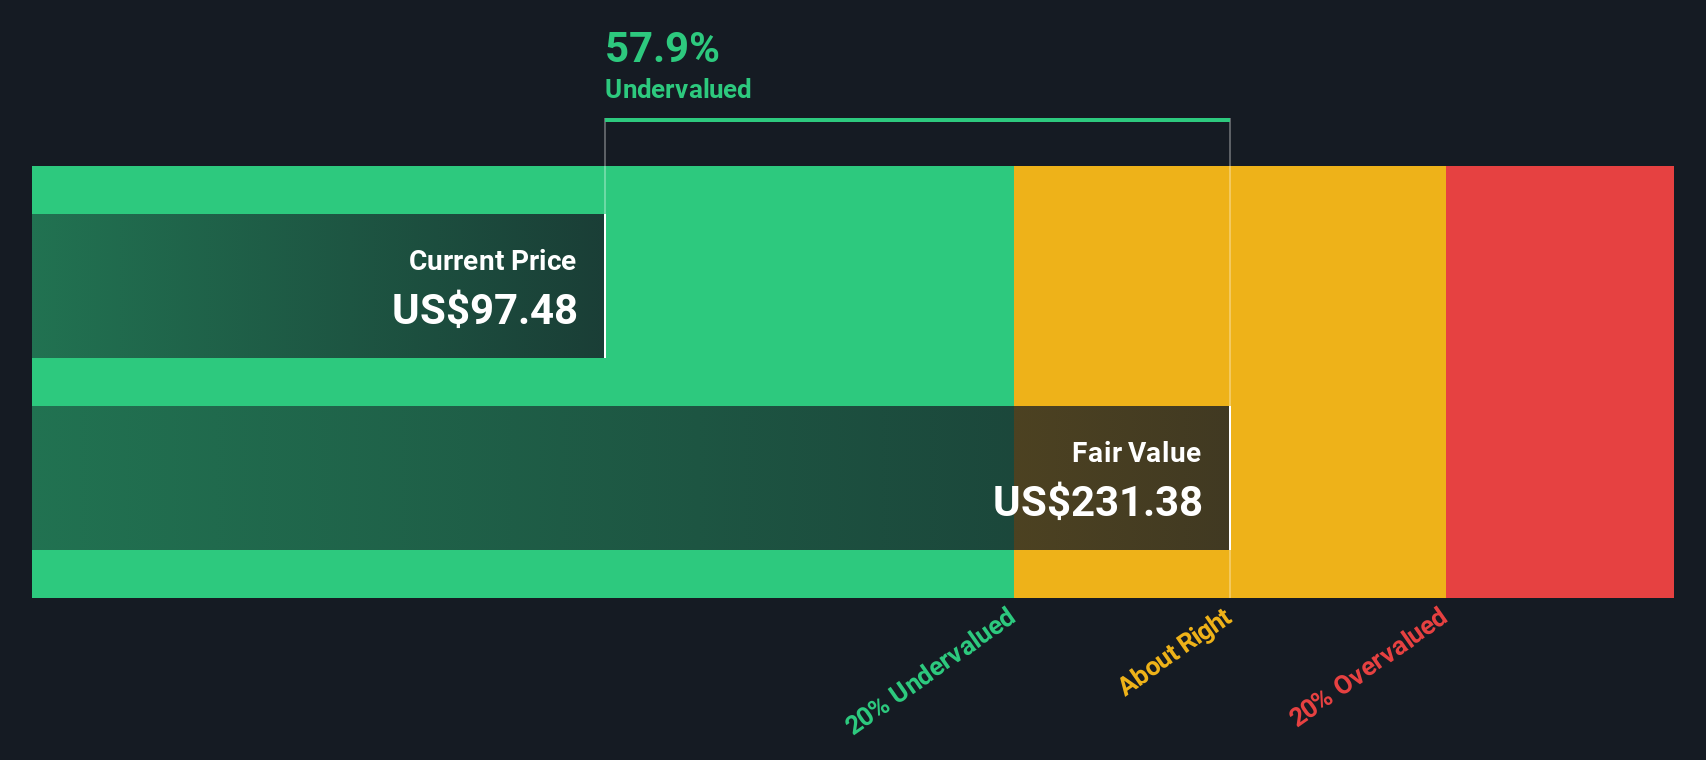
When all these cash flows are discounted back to today, Southern’s intrinsic value comes out to $294.40 per share. This result suggests the DCF model indicates the stock trades at a 68.5% discount, signaling significant potential upside from current levels.
Result: UNDERVALUED
Our Discounted Cash Flow (DCF) analysis suggests Southern is undervalued by 68.5%. Track this in your watchlist or portfolio, or discover 840 more undervalued stocks based on cash flows.
Approach 2: Southern Price vs Earnings
The Price-to-Earnings (PE) ratio is a widely used valuation tool for profitable companies because it directly connects a company’s market value with its underlying earnings power. For a business like Southern that generates consistent profits, the PE ratio helps investors quickly gauge how much they are paying for each dollar of current earnings.
However, a "fair" PE ratio can vary depending on factors such as growth expectations and risk. Companies expected to grow faster or with lower perceived risk often warrant higher PE multiples. In contrast, companies facing uncertainty or slower growth typically have lower ratios.
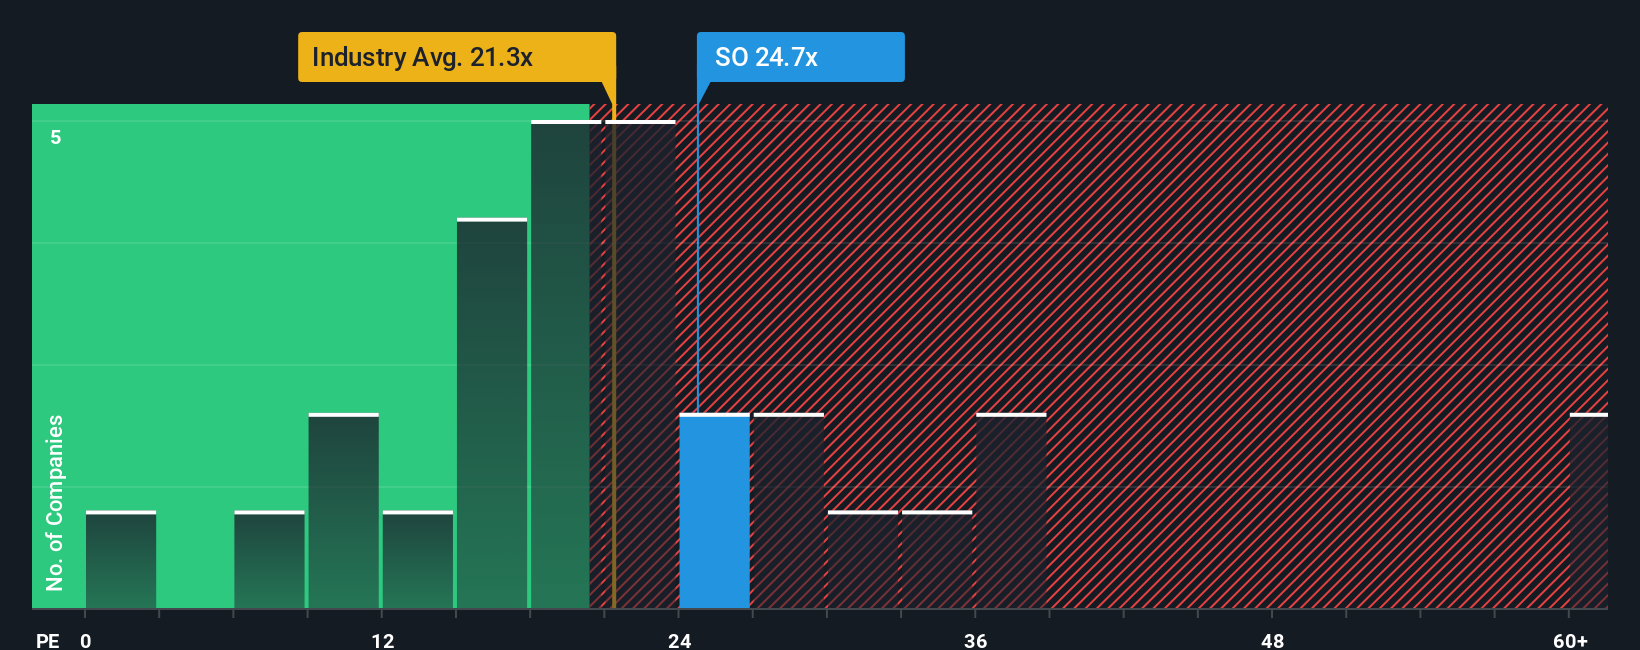
Southern’s current PE ratio sits at 22.9x. Looking at key benchmarks, this is slightly above the Electric Utilities industry average of 21.6x, yet under the peer average of 25.4x. Although industry and peer comparisons are useful, they do not account for unique company factors.
Simply Wall St’s "Fair Ratio" is calculated at 23.4x for Southern. This proprietary metric considers the company’s earnings growth, profit margins, risk profile, industry trends, and market capitalization, providing a more tailored benchmark than generic comparisons.
Comparing Southern’s actual PE of 22.9x to its Fair Ratio of 23.4x suggests the stock is priced almost exactly where it should be based on fundamentals and company-specific factors.
Result: ABOUT RIGHT
PE ratios tell one story, but what if the real opportunity lies elsewhere? Discover 1411 companies where insiders are betting big on explosive growth.
Upgrade Your Decision Making: Choose your Southern Narrative
Earlier we mentioned that there is an even better way to understand valuation, so let's introduce you to Narratives. A Narrative is your personal story about a company, combining your view of its future, such as projected growth, earnings, margins, and key milestones, with the financial numbers to build your own version of a fair value.
Narratives work by connecting the dots between the company's business story and your financial expectations, allowing you to tie forecasts directly to what a fair price should be. They are simple for any investor to use, thanks to the step-by-step tools available on Simply Wall St’s Community page, used by millions of investors.
With Narratives, you can quickly see when your Fair Value estimate says a stock is under or over-valued compared to its current price, helping you decide if it's a good time to buy, hold, or sell. Every Narrative updates dynamically as fresh news, financials, or analyst earnings arrive, so your fair value remains current.
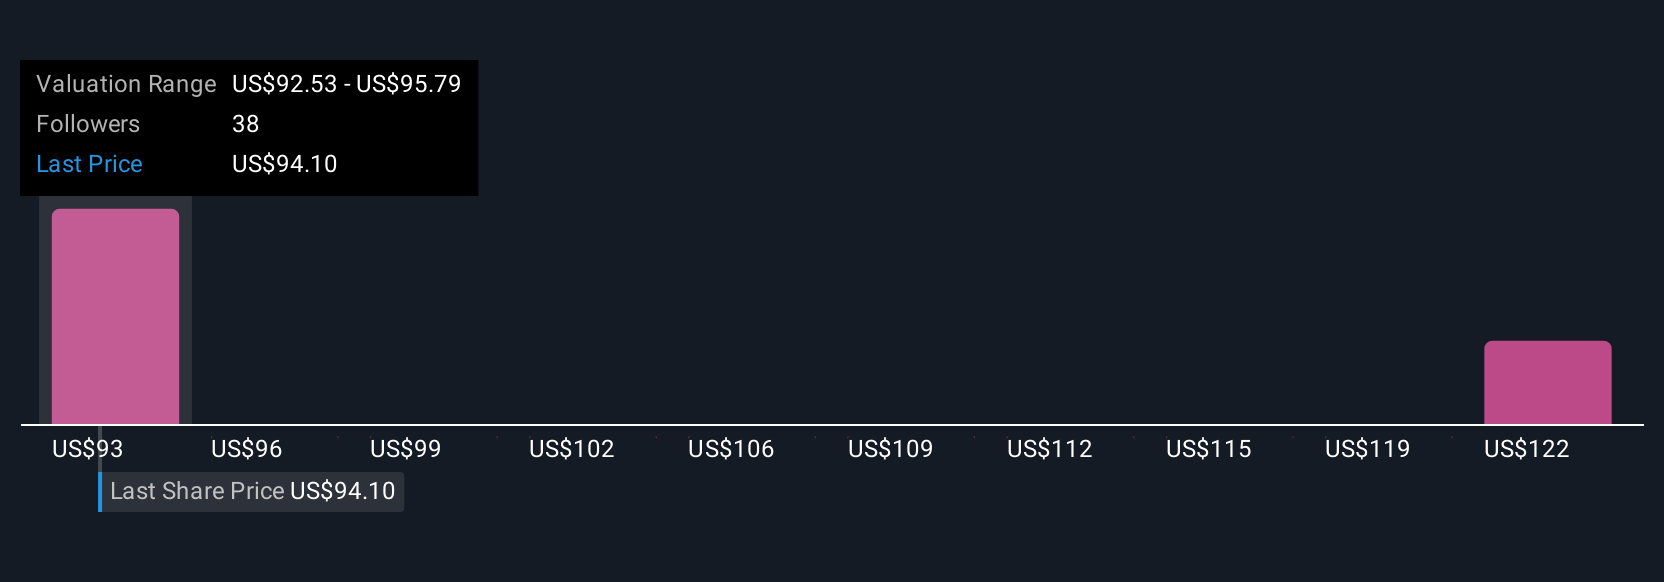
For Southern, one investor might see strong Southeast demand and stable regulation driving a $108 price target, while another could focus on higher capital costs and risk, leading to a more cautious $75 target. Narratives let you compare these perspectives instantly and tailor investment decisions to your personal outlook.
Do you think there's more to the story for Southern? Head over to our Community to see what others are saying!
This article by Simply Wall St is general in nature. We provide commentary based on historical data and analyst forecasts only using an unbiased methodology and our articles are not intended to be financial advice. It does not constitute a recommendation to buy or sell any stock, and does not take account of your objectives, or your financial situation. We aim to bring you long-term focused analysis driven by fundamental data. Note that our analysis may not factor in the latest price-sensitive company announcements or qualitative material. Simply Wall St has no position in any stocks mentioned.
New: Manage All Your Stock Portfolios in One Place
We've created the ultimate portfolio companion for stock investors, and it's free.
• Connect an unlimited number of Portfolios and see your total in one currency
• Be alerted to new Warning Signs or Risks via email or mobile
• Track the Fair Value of your stocks
Have feedback on this article? Concerned about the content? Get in touch with us directly. Alternatively, email editorial-team@simplywallst.com
About NYSE:SO
Southern
Through its subsidiaries, engages in the generation, transmission, and distribution of electricity.
Good value average dividend payer.
Similar Companies
Market Insights

Advertisement
Community Narratives
MINISO's fair value is projected at 26.69 with an anticipated PE ratio shift of 20x
Fair Value US$24.03|11.0% undervalued
BE
Community Contributor
Procter & Gamble: A Dividend Giant Facing Slowing Growth
Fair Value US$119.81|23.3% overvalued
AN
Community Contributor
Eli Lilly's Future Growth Driven by Tirzepatide and Favorable Market Conditions
Fair Value US$1.19k|13.8% undervalued
EA
Community Contributor