- United States
- /
- Electric Utilities
- /
- NYSE:TXNM
Calculating The Fair Value Of PNM Resources, Inc. (NYSE:PNM)

Key Insights
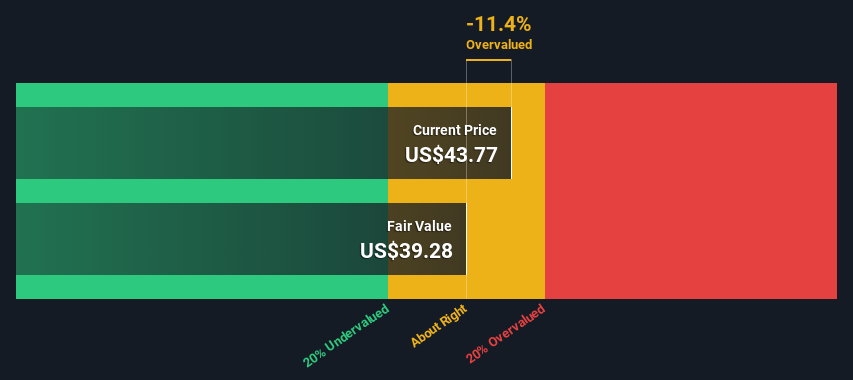
- The projected fair value for PNM Resources is US$39.28 based on Dividend Discount Model
- Current share price of US$43.77 suggests PNM Resources is potentially trading close to its fair value
- Analyst price target for PNM is US$50.77, which is 29% above our fair value estimate
In this article we are going to estimate the intrinsic value of PNM Resources, Inc. (NYSE:PNM) by estimating the company's future cash flows and discounting them to their present value. This will be done using the Discounted Cash Flow (DCF) model. Models like these may appear beyond the comprehension of a lay person, but they're fairly easy to follow.
We generally believe that a company's value is the present value of all of the cash it will generate in the future. However, a DCF is just one valuation metric among many, and it is not without flaws. If you still have some burning questions about this type of valuation, take a look at the Simply Wall St analysis model.
See our latest analysis for PNM Resources
Step By Step Through The Calculation
We have to calculate the value of PNM Resources slightly differently to other stocks because it is a electric utilities company. Instead of using free cash flows, which are hard to estimate and often not reported by analysts in this industry, dividends per share (DPS) payments are used. This often underestimates the value of a stock, but it can still be good as a comparison to competitors. The 'Gordon Growth Model' is used, which simply assumes that dividend payments will continue to increase at a sustainable growth rate forever. For a number of reasons a very conservative growth rate is used that cannot exceed that of a company's Gross Domestic Product (GDP). In this case we used the 5-year average of the 10-year government bond yield (2.2%). The expected dividend per share is then discounted to today's value at a cost of equity of 6.2%. Relative to the current share price of US$43.8, the company appears around fair value at the time of writing. The assumptions in any calculation have a big impact on the valuation, so it is better to view this as a rough estimate, not precise down to the last cent.
Value Per Share = Expected Dividend Per Share / (Discount Rate - Perpetual Growth Rate)
= US$1.6 / (6.2% – 2.2%)
= US$39.3
The Assumptions
The calculation above is very dependent on two assumptions. The first is the discount rate and the other is the cash flows. If you don't agree with these result, have a go at the calculation yourself and play with the assumptions. The DCF also does not consider the possible cyclicality of an industry, or a company's future capital requirements, so it does not give a full picture of a company's potential performance. Given that we are looking at PNM Resources as potential shareholders, the cost of equity is used as the discount rate, rather than the cost of capital (or weighted average cost of capital, WACC) which accounts for debt. In this calculation we've used 6.2%, which is based on a levered beta of 0.800. Beta is a measure of a stock's volatility, compared to the market as a whole. We get our beta from the industry average beta of globally comparable companies, with an imposed limit between 0.8 and 2.0, which is a reasonable range for a stable business.
SWOT Analysis for PNM Resources
- Earnings growth over the past year exceeded the industry.
- Debt is well covered by earnings.
- Dividend is low compared to the top 25% of dividend payers in the Electric Utilities market.
- Annual earnings are forecast to grow for the next 3 years.
- Good value based on P/E ratio compared to estimated Fair P/E ratio.
- Debt is not well covered by operating cash flow.
- Paying a dividend but company has no free cash flows.
- Annual earnings are forecast to grow slower than the American market.
Next Steps:
Valuation is only one side of the coin in terms of building your investment thesis, and it ideally won't be the sole piece of analysis you scrutinize for a company. It's not possible to obtain a foolproof valuation with a DCF model. Preferably you'd apply different cases and assumptions and see how they would impact the company's valuation. For instance, if the terminal value growth rate is adjusted slightly, it can dramatically alter the overall result. For PNM Resources, we've put together three further factors you should further research:
- Risks: Consider for instance, the ever-present spectre of investment risk. We've identified 2 warning signs with PNM Resources (at least 1 which is significant) , and understanding these should be part of your investment process.
- Future Earnings: How does PNM's growth rate compare to its peers and the wider market? Dig deeper into the analyst consensus number for the upcoming years by interacting with our free analyst growth expectation chart.
- Other Solid Businesses: Low debt, high returns on equity and good past performance are fundamental to a strong business. Why not explore our interactive list of stocks with solid business fundamentals to see if there are other companies you may not have considered!
PS. The Simply Wall St app conducts a discounted cash flow valuation for every stock on the NYSE every day. If you want to find the calculation for other stocks just search here.
Mobile Infrastructure for Defense and Disaster
The next wave in robotics isn't humanoid. Its fully autonomous towers delivering 5G, ISR, and radar in under 30 minutes, anywhere.
Get the investor briefing before the next round of contracts
Sponsored On Behalf of CiTechValuation is complex, but we're here to simplify it.
Discover if TXNM Energy might be undervalued or overvalued with our detailed analysis, featuring fair value estimates, potential risks, dividends, insider trades, and its financial condition.
Access Free AnalysisHave feedback on this article? Concerned about the content? Get in touch with us directly. Alternatively, email editorial-team (at) simplywallst.com.
This article by Simply Wall St is general in nature. We provide commentary based on historical data and analyst forecasts only using an unbiased methodology and our articles are not intended to be financial advice. It does not constitute a recommendation to buy or sell any stock, and does not take account of your objectives, or your financial situation. We aim to bring you long-term focused analysis driven by fundamental data. Note that our analysis may not factor in the latest price-sensitive company announcements or qualitative material. Simply Wall St has no position in any stocks mentioned.
About NYSE:TXNM
TXNM Energy
Through its subsidiaries, provides electricity and electric services in the United States.
Average dividend payer with moderate growth potential.
Similar Companies
Market Insights

Weekly Picks

THE KINGDOM OF BROWN GOODS: WHY MGPI IS BEING CRUSHED BY INVENTORY & PRIMED FOR RESURRECTION


Why Vertical Aerospace (NYSE: EVTL) is Worth Possibly Over 13x its Current Price


The Quiet Giant That Became AI’s Power Grid
Recently Updated Narratives

Butler National (Buks) outperforms.


A tech powerhouse quietly powering the world’s AI infrastructure.


Keppel DC REIT (SGX: AJBU) is a resilient gem in the data center space.
Popular Narratives

MicroVision will explode future revenue by 380.37% with a vision towards success


Crazy Undervalued 42 Baggers Silver Play (Active & Running Mine)


