Advertisement
- United States
- /
- Electric Utilities
- /
- NYSE:OGE
Is OGE Energy Fairly Priced After Recent Regulatory and Grid Modernization Updates?

Simply Wall St
Reviewed by Bailey Pemberton
- Wondering if OGE Energy stock is actually a bargain or overpriced today? You are not alone, and we are about to break down what really drives its value.
- The stock has climbed 12.2% over the past year and is up 7.3% year-to-date, though it recently pulled back by 2.4% in the last week and 3.5% over the past month.
- A series of regulatory developments and market updates have kept investors attentive, helping shape recent price swings. Notably, industry-wide grid modernization efforts and changes in utility-sector sentiment have added meaningful context to OGE Energy’s movement.
- When it comes to valuation, OGE Energy gets a 3 out of 6 score, which means it looks undervalued on half the key criteria. We will dig into what those methods reveal about the company’s true worth, and at the end, we will show you a smarter way to look at valuation that goes beyond the usual numbers.
Find out why OGE Energy's 12.2% return over the last year is lagging behind its peers.
Approach 1: OGE Energy Dividend Discount Model (DDM) Analysis
The Dividend Discount Model (DDM) is designed to estimate a stock’s true value based on the company’s future dividend payments, which are then discounted back to their value today. This method is especially useful for established companies with stable and predictable dividend distributions, such as OGE Energy.
For OGE Energy, the model uses a recent annual dividend per share of $1.75, a payout ratio of 76.67%, and a return on equity (ROE) of 9.83%. Based on these figures, the projected dividend growth rate is calculated to be 2.3%, derived from the formula (1 - payout ratio) x ROE. The sustainability of this growth depends on OGE Energy maintaining its current profitability and not increasing its payout ratio much further.
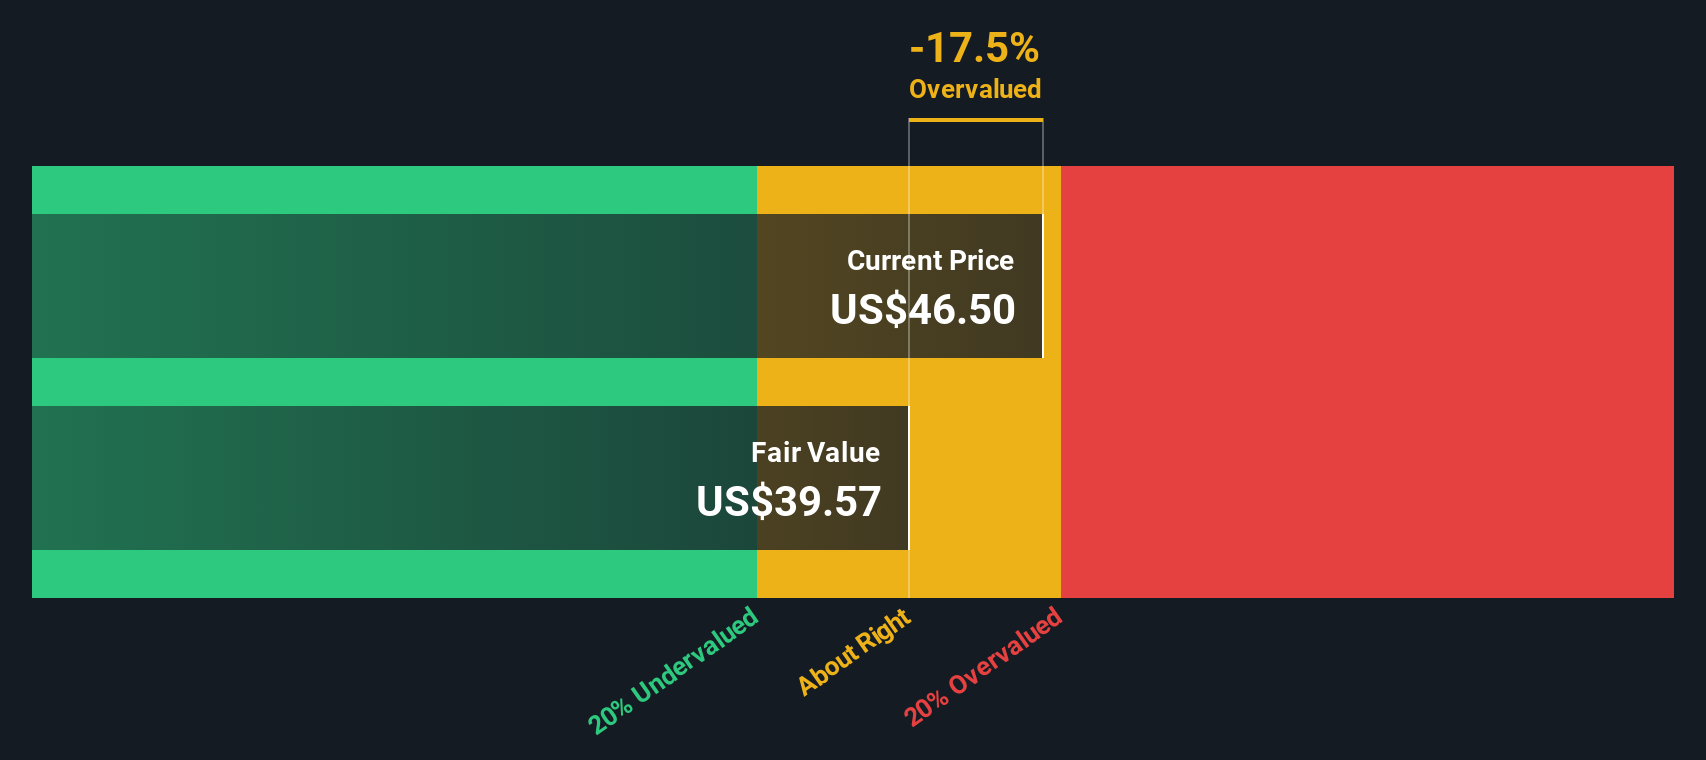
Using the DDM, the estimated intrinsic value per share is $39.05. When compared to the current share price, this suggests the stock is approximately 13.4% overvalued. In short, the DDM indicates that OGE Energy’s value is currently ahead of its dividend fundamentals.
Result: OVERVALUED
Our Dividend Discount Model (DDM) analysis suggests OGE Energy may be overvalued by 13.4%. Discover 842 undervalued stocks or create your own screener to find better value opportunities.
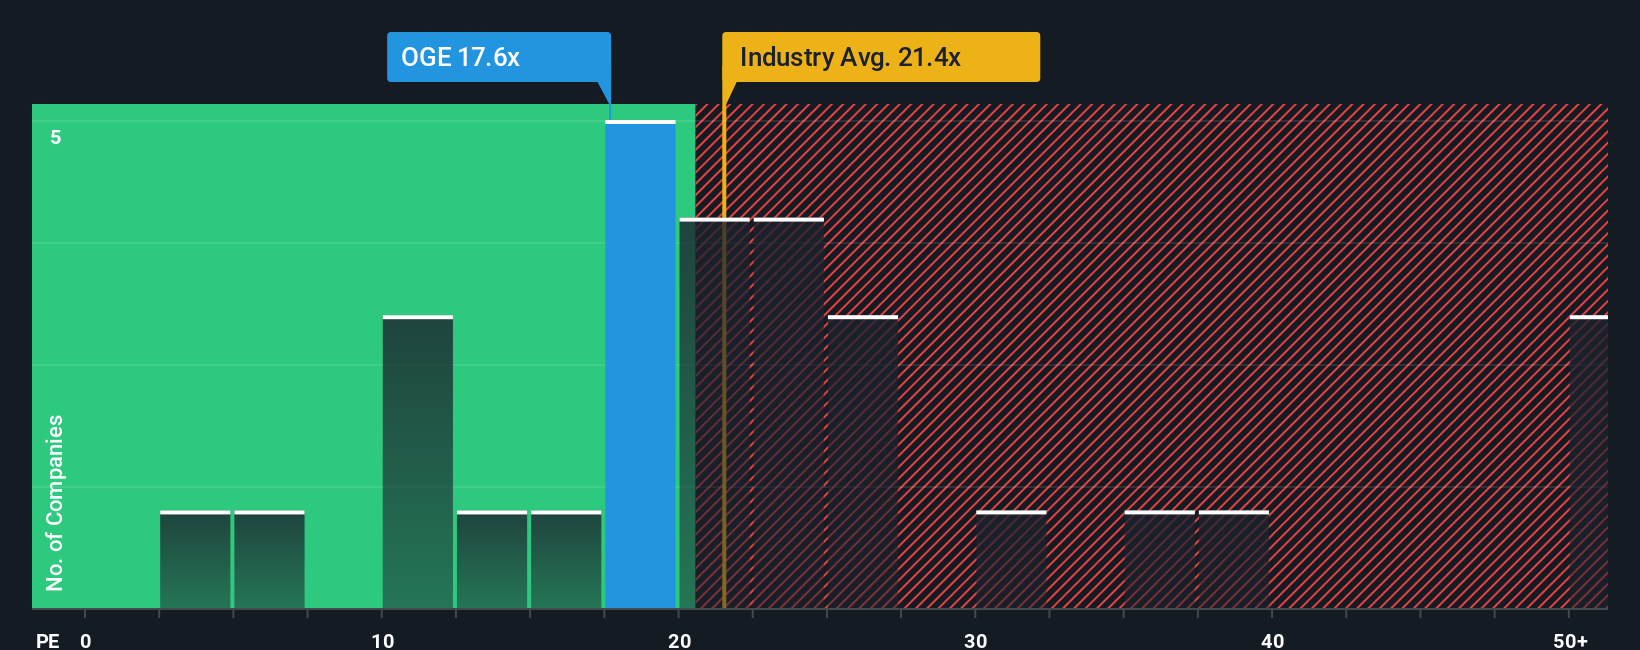
Approach 2: OGE Energy Price vs Earnings
The price-to-earnings (PE) ratio is commonly used to value profitable companies because it directly connects the share price to the company’s actual earnings performance. For companies like OGE Energy that consistently generate profits, the PE ratio gives a clear picture of how much investors are willing to pay today for each dollar of earnings.
What counts as a “normal” or “fair” PE ratio varies depending on factors like expected growth, profit stability, and risk. If investors anticipate strong future growth or see OGE as a relatively safe bet, they will generally accept a higher PE ratio. On the other hand, slower growth or higher risk often justifies a lower multiple.
Right now, OGE Energy is trading at a PE ratio of 17.7x. That sits comfortably below the industry average of 21.6x as well as its peer group’s average of 23.9x. However, these raw comparisons do not tell the whole story. Simply Wall St’s proprietary “Fair Ratio” takes into account the company’s earnings growth, its industry, profit margins, risk profile, and market cap. In this case, OGE’s Fair Ratio is 17.8x.
The Fair Ratio is a more rounded reflection of what investors should reasonably pay for OGE’s earnings. It is more insightful than just looking at industry or peer averages alone, as it incorporates company-specific growth and risks into the equation.
Comparing OGE’s current PE of 17.7x to the Fair Ratio of 17.8x, the difference is negligible, suggesting the stock is valued about right based on its present fundamentals.
Result: ABOUT RIGHT
PE ratios tell one story, but what if the real opportunity lies elsewhere? Discover 1411 companies where insiders are betting big on explosive growth.
Upgrade Your Decision Making: Choose your OGE Energy Narrative
Earlier we mentioned that there is an even better way to understand valuation, so let’s introduce you to Narratives, a smarter, more dynamic approach for making investment decisions.
A Narrative is simply your perspective, or “story,” about how you think a company’s future will unfold, linking what you believe about its growth and profitability to an estimated fair value. Rather than just relying on static numbers, Narratives let you combine your forecasts (like future revenue, earnings, and profit margins) with the numbers that matter to you most, so you can see if the current price fits your expectations.
On Simply Wall St’s Community page, millions of investors use Narratives to track and update their fair value for companies like OGE Energy, ensuring their view always reflects the latest news or earnings reports. This empowers you to compare your own fair value with the current price, making it easier to decide when to buy or sell, and to understand what others in the market think, all in a way that’s transparent and easy to use.
For example, some investors believe sustained customer and data center growth will justify a bullish price target of $52, while others cite regulatory and regional risks and see a fair value as low as $40. This shows how Narratives help turn analysis into your personal investment roadmap.
Do you think there's more to the story for OGE Energy? Head over to our Community to see what others are saying!
This article by Simply Wall St is general in nature. We provide commentary based on historical data and analyst forecasts only using an unbiased methodology and our articles are not intended to be financial advice. It does not constitute a recommendation to buy or sell any stock, and does not take account of your objectives, or your financial situation. We aim to bring you long-term focused analysis driven by fundamental data. Note that our analysis may not factor in the latest price-sensitive company announcements or qualitative material. Simply Wall St has no position in any stocks mentioned.
New: AI Stock Screener & Alerts
Our new AI Stock Screener scans the market every day to uncover opportunities.
• Dividend Powerhouses (3%+ Yield)
• Undervalued Small Caps with Insider Buying
• High growth Tech and AI Companies
Or build your own from over 50 metrics.
Have feedback on this article? Concerned about the content? Get in touch with us directly. Alternatively, email editorial-team@simplywallst.com
About NYSE:OGE
OGE Energy
Through its subsidiary, operates as an energy services provider in the United States.
Solid track record average dividend payer.
Similar Companies
Market Insights

Advertisement
Community Narratives
The company that turned a verb into a global necessity and basically runs the modern internet, digital ads, smartphones, maps, and AI.
Fair Value US$300.00|7.5% undervalued
OS
Community Contributor
Flowers Foods Pays A Fair Price For Health
Fair Value US$16.12|25.4% undervalued
NV
Community Contributor
TMX Group will thrive with 33.3% profit margin and enduring market moat
Fair Value CA$49.90|3.6% overvalued
LI
Community Contributor
The "Molecular Pencil": Why Beam's Technology is Built to Win
Fair Value US$65.01|65.0% undervalued
DA
Community Contributor