Stock Analysis
- United States
- /
- Other Utilities
- /
- NYSE:DTE
What Is DTE Energy's (NYSE:DTE) P/E Ratio After Its Share Price Tanked?

To the annoyance of some shareholders, DTE Energy (NYSE:DTE) shares are down a considerable 32% in the last month. The recent drop has obliterated the annual return, with the share price now down 26% over that longer period.
All else being equal, a share price drop should make a stock more attractive to potential investors. While the market sentiment towards a stock is very changeable, in the long run, the share price will tend to move in the same direction as earnings per share. So, on certain occasions, long term focussed investors try to take advantage of pessimistic expectations to buy shares at a better price. One way to gauge market expectations of a stock is to look at its Price to Earnings Ratio (PE Ratio). A high P/E implies that investors have high expectations of what a company can achieve compared to a company with a low P/E ratio.
See our latest analysis for DTE Energy
Does DTE Energy Have A Relatively High Or Low P/E For Its Industry?
DTE Energy's P/E of 14.45 indicates relatively low sentiment towards the stock. If you look at the image below, you can see DTE Energy has a lower P/E than the average (17.5) in the integrated utilities industry classification.
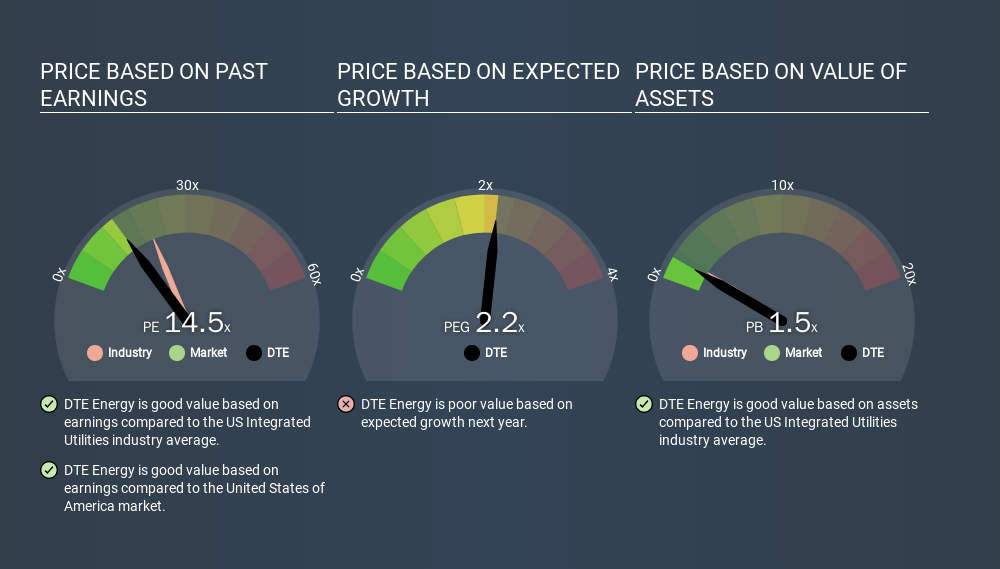
This suggests that market participants think DTE Energy will underperform other companies in its industry. While current expectations are low, the stock could be undervalued if the situation is better than the market assumes. If you consider the stock interesting, further research is recommended. For example, I often monitor director buying and selling.
How Growth Rates Impact P/E Ratios
Generally speaking the rate of earnings growth has a profound impact on a company's P/E multiple. When earnings grow, the 'E' increases, over time. And in that case, the P/E ratio itself will drop rather quickly. And as that P/E ratio drops, the company will look cheap, unless its share price increases.
DTE Energy's earnings per share grew by -2.1% in the last twelve months. And its annual EPS growth rate over 5 years is 4.3%.
Don't Forget: The P/E Does Not Account For Debt or Bank Deposits
Don't forget that the P/E ratio considers market capitalization. In other words, it does not consider any debt or cash that the company may have on the balance sheet. In theory, a company can lower its future P/E ratio by using cash or debt to invest in growth.
Such spending might be good or bad, overall, but the key point here is that you need to look at debt to understand the P/E ratio in context.
How Does DTE Energy's Debt Impact Its P/E Ratio?
DTE Energy's net debt is 99% of its market cap. This is a reasonably significant level of debt -- all else being equal you'd expect a much lower P/E than if it had net cash.
The Bottom Line On DTE Energy's P/E Ratio
DTE Energy's P/E is 14.5 which is above average (13.3) in its market. With meaningful debt and only modest recent earnings growth, the market is either expecting reliable long-term growth, or a near-term improvement. What can be absolutely certain is that the market has become significantly less optimistic about DTE Energy over the last month, with the P/E ratio falling from 21.2 back then to 14.5 today. For those who don't like to trade against momentum, that could be a warning sign, but a contrarian investor might want to take a closer look.
Investors should be looking to buy stocks that the market is wrong about. If the reality for a company is better than it expects, you can make money by buying and holding for the long term. So this free visual report on analyst forecasts could hold the key to an excellent investment decision.
But note: DTE Energy may not be the best stock to buy. So take a peek at this free list of interesting companies with strong recent earnings growth (and a P/E ratio below 20).
If you spot an error that warrants correction, please contact the editor at editorial-team@simplywallst.com. This article by Simply Wall St is general in nature. It does not constitute a recommendation to buy or sell any stock, and does not take account of your objectives, or your financial situation. Simply Wall St has no position in the stocks mentioned.
We aim to bring you long-term focused research analysis driven by fundamental data. Note that our analysis may not factor in the latest price-sensitive company announcements or qualitative material. Thank you for reading.
About NYSE:DTE
Solid track record and fair value.
