
Advertisement
- United States
- /
- Electric Utilities
- /
- NasdaqGS:OTTR
Otter Tail (NASDAQ:OTTR) Has A Somewhat Strained Balance Sheet
Legendary fund manager Li Lu (who Charlie Munger backed) once said, 'The biggest investment risk is not the volatility of prices, but whether you will suffer a permanent loss of capital.' When we think about how risky a company is, we always like to look at its use of debt, since debt overload can lead to ruin. As with many other companies Otter Tail Corporation (NASDAQ:OTTR) makes use of debt. But the real question is whether this debt is making the company risky.
When Is Debt A Problem?
Debt assists a business until the business has trouble paying it off, either with new capital or with free cash flow. Ultimately, if the company can't fulfill its legal obligations to repay debt, shareholders could walk away with nothing. However, a more usual (but still expensive) situation is where a company must dilute shareholders at a cheap share price simply to get debt under control. By replacing dilution, though, debt can be an extremely good tool for businesses that need capital to invest in growth at high rates of return. The first thing to do when considering how much debt a business uses is to look at its cash and debt together.
What Is Otter Tail's Debt?
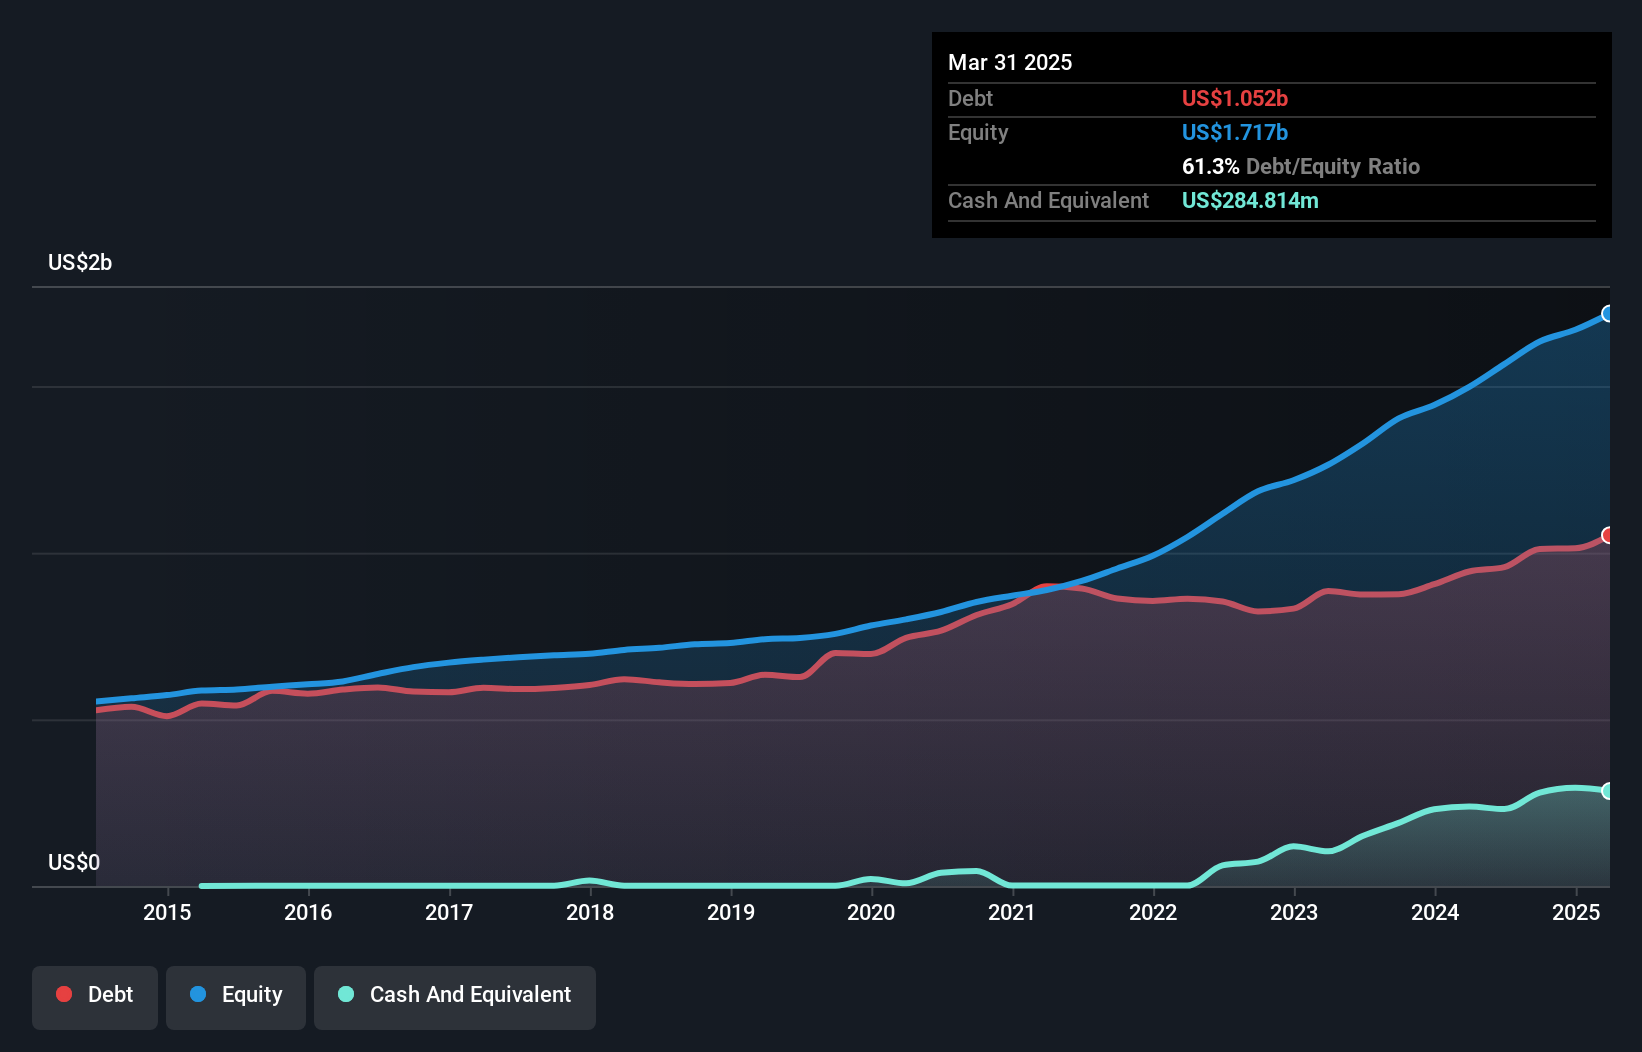
As you can see below, at the end of March 2025, Otter Tail had US$1.05b of debt, up from US$943.5m a year ago. Click the image for more detail. However, it also had US$284.8m in cash, and so its net debt is US$767.6m.
A Look At Otter Tail's Liabilities
According to the last reported balance sheet, Otter Tail had liabilities of US$248.4m due within 12 months, and liabilities of US$1.73b due beyond 12 months. On the other hand, it had cash of US$284.8m and US$184.1m worth of receivables due within a year. So its liabilities outweigh the sum of its cash and (near-term) receivables by US$1.51b.
Otter Tail has a market capitalization of US$3.23b, so it could very likely raise cash to ameliorate its balance sheet, if the need arose. But it's clear that we should definitely closely examine whether it can manage its debt without dilution.
View our latest analysis for Otter Tail
We use two main ratios to inform us about debt levels relative to earnings. The first is net debt divided by earnings before interest, tax, depreciation, and amortization (EBITDA), while the second is how many times its earnings before interest and tax (EBIT) covers its interest expense (or its interest cover, for short). The advantage of this approach is that we take into account both the absolute quantum of debt (with net debt to EBITDA) and the actual interest expenses associated with that debt (with its interest cover ratio).
Otter Tail's net debt of 1.6 times EBITDA suggests graceful use of debt. And the alluring interest cover (EBIT of 8.7 times interest expense) certainly does not do anything to dispel this impression. But the other side of the story is that Otter Tail saw its EBIT decline by 6.2% over the last year. That sort of decline, if sustained, will obviously make debt harder to handle. There's no doubt that we learn most about debt from the balance sheet. But ultimately the future profitability of the business will decide if Otter Tail can strengthen its balance sheet over time. So if you want to see what the professionals think, you might find this free report on analyst profit forecasts to be interesting.
But our final consideration is also important, because a company cannot pay debt with paper profits; it needs cold hard cash. So we always check how much of that EBIT is translated into free cash flow. Looking at the most recent three years, Otter Tail recorded free cash flow of 34% of its EBIT, which is weaker than we'd expect. That's not great, when it comes to paying down debt.

Our View
Neither Otter Tail's ability to grow its EBIT nor its conversion of EBIT to free cash flow gave us confidence in its ability to take on more debt. But it seems to be able to cover its interest expense with its EBIT without much trouble. We should also note that Electric Utilities industry companies like Otter Tail commonly do use debt without problems. Looking at all the angles mentioned above, it does seem to us that Otter Tail is a somewhat risky investment as a result of its debt. That's not necessarily a bad thing, since leverage can boost returns on equity, but it is something to be aware of. When analysing debt levels, the balance sheet is the obvious place to start. However, not all investment risk resides within the balance sheet - far from it. Be aware that Otter Tail is showing 3 warning signs in our investment analysis , and 1 of those is concerning...
Of course, if you're the type of investor who prefers buying stocks without the burden of debt, then don't hesitate to discover our exclusive list of net cash growth stocks, today.
New: AI Stock Screener & Alerts
Our new AI Stock Screener scans the market every day to uncover opportunities.
• Dividend Powerhouses (3%+ Yield)
• Undervalued Small Caps with Insider Buying
• High growth Tech and AI Companies
Or build your own from over 50 metrics.
Have feedback on this article? Concerned about the content? Get in touch with us directly. Alternatively, email editorial-team (at) simplywallst.com.
This article by Simply Wall St is general in nature. We provide commentary based on historical data and analyst forecasts only using an unbiased methodology and our articles are not intended to be financial advice. It does not constitute a recommendation to buy or sell any stock, and does not take account of your objectives, or your financial situation. We aim to bring you long-term focused analysis driven by fundamental data. Note that our analysis may not factor in the latest price-sensitive company announcements or qualitative material. Simply Wall St has no position in any stocks mentioned.
About NasdaqGS:OTTR
Otter Tail
Engages in electric utility, manufacturing, and plastic pipe businesses in the United States.
Excellent balance sheet established dividend payer.
Similar Companies
Market Insights

Advertisement
Community Narratives
MicroVision will explode future revenue by 380.37% with a vision towards success
Fair Value US$60.00|98.5% undervalued
TH
Community Contributor
The Indispensable Artery for a New North American Economy
Fair Value CA$132.87|2.3% undervalued
TI
Community Contributor