Stock Analysis
- United States
- /
- Logistics
- /
- NasdaqGS:CHRW
Shareholders in C.H. Robinson Worldwide (NASDAQ:CHRW) are in the red if they invested three years ago


Many investors define successful investing as beating the market average over the long term. But in any portfolio, there are likely to be some stocks that fall short of that benchmark. We regret to report that long term C.H. Robinson Worldwide, Inc. (NASDAQ:CHRW) shareholders have had that experience, with the share price dropping 12% in three years, versus a market return of about 16%.
It's worthwhile assessing if the company's economics have been moving in lockstep with these underwhelming shareholder returns, or if there is some disparity between the two. So let's do just that.
Check out our latest analysis for C.H. Robinson Worldwide
To quote Buffett, 'Ships will sail around the world but the Flat Earth Society will flourish. There will continue to be wide discrepancies between price and value in the marketplace...' One way to examine how market sentiment has changed over time is to look at the interaction between a company's share price and its earnings per share (EPS).
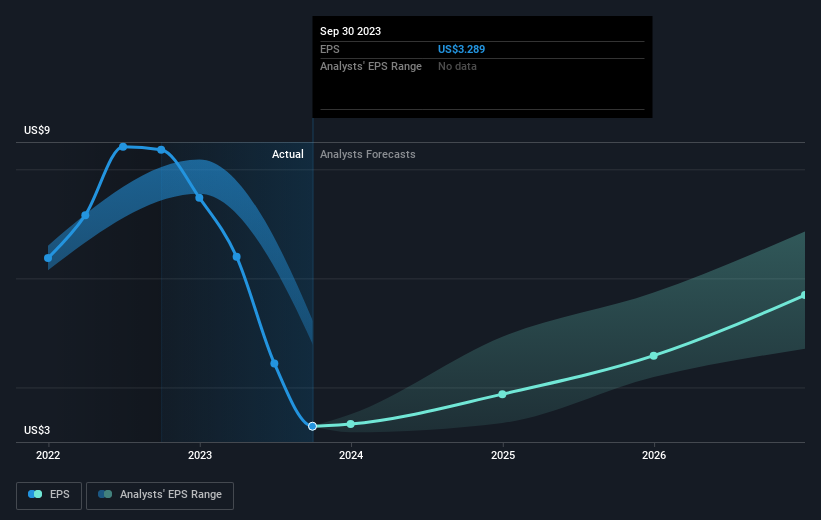
C.H. Robinson Worldwide saw its EPS decline at a compound rate of 0.3% per year, over the last three years. This reduction in EPS is slower than the 4% annual reduction in the share price. So it seems the market was too confident about the business, in the past.
You can see how EPS has changed over time in the image below (click on the chart to see the exact values).
It's good to see that there was some significant insider buying in the last three months. That's a positive. On the other hand, we think the revenue and earnings trends are much more meaningful measures of the business. Dive deeper into the earnings by checking this interactive graph of C.H. Robinson Worldwide's earnings, revenue and cash flow.
What About Dividends?
It is important to consider the total shareholder return, as well as the share price return, for any given stock. The TSR incorporates the value of any spin-offs or discounted capital raisings, along with any dividends, based on the assumption that the dividends are reinvested. It's fair to say that the TSR gives a more complete picture for stocks that pay a dividend. In the case of C.H. Robinson Worldwide, it has a TSR of -5.4% for the last 3 years. That exceeds its share price return that we previously mentioned. And there's no prize for guessing that the dividend payments largely explain the divergence!
A Different Perspective
Investors in C.H. Robinson Worldwide had a tough year, with a total loss of 5.3% (including dividends), against a market gain of about 22%. Even the share prices of good stocks drop sometimes, but we want to see improvements in the fundamental metrics of a business, before getting too interested. On the bright side, long term shareholders have made money, with a gain of 2% per year over half a decade. If the fundamental data continues to indicate long term sustainable growth, the current sell-off could be an opportunity worth considering. While it is well worth considering the different impacts that market conditions can have on the share price, there are other factors that are even more important. Consider risks, for instance. Every company has them, and we've spotted 2 warning signs for C.H. Robinson Worldwide you should know about.
C.H. Robinson Worldwide is not the only stock insiders are buying. So take a peek at this free list of growing companies with insider buying.
Please note, the market returns quoted in this article reflect the market weighted average returns of stocks that currently trade on American exchanges.
New: AI Stock Screener & Alerts
Our new AI Stock Screener scans the market every day to uncover opportunities.
• Dividend Powerhouses (3%+ Yield)
• Undervalued Small Caps with Insider Buying
• High growth Tech and AI Companies
Or build your own from over 50 metrics.
Have feedback on this article? Concerned about the content? Get in touch with us directly. Alternatively, email editorial-team (at) simplywallst.com.
This article by Simply Wall St is general in nature. We provide commentary based on historical data and analyst forecasts only using an unbiased methodology and our articles are not intended to be financial advice. It does not constitute a recommendation to buy or sell any stock, and does not take account of your objectives, or your financial situation. We aim to bring you long-term focused analysis driven by fundamental data. Note that our analysis may not factor in the latest price-sensitive company announcements or qualitative material. Simply Wall St has no position in any stocks mentioned.
About NasdaqGS:CHRW
C.H. Robinson Worldwide
Provides freight transportation services, and related logistics and supply chain services in the United States and internationally.
Adequate balance sheet average dividend payer.
