- United States
- /
- Transportation
- /
- NasdaqGS:ARCB
The total return for ArcBest (NASDAQ:ARCB) investors has risen faster than earnings growth over the last five years


ArcBest Corporation (NASDAQ:ARCB) shareholders might be concerned after seeing the share price drop 18% in the last week. But that scarcely detracts from the really solid long term returns generated by the company over five years. Indeed, the share price is up an impressive 269% in that time. So while it's never fun to see a share price fall, it's important to look at a longer time horizon. The more important question is whether the stock is too cheap or too expensive today.
While the stock has fallen 18% this week, it's worth focusing on the longer term and seeing if the stocks historical returns have been driven by the underlying fundamentals.
View our latest analysis for ArcBest
To paraphrase Benjamin Graham: Over the short term the market is a voting machine, but over the long term it's a weighing machine. One way to examine how market sentiment has changed over time is to look at the interaction between a company's share price and its earnings per share (EPS).
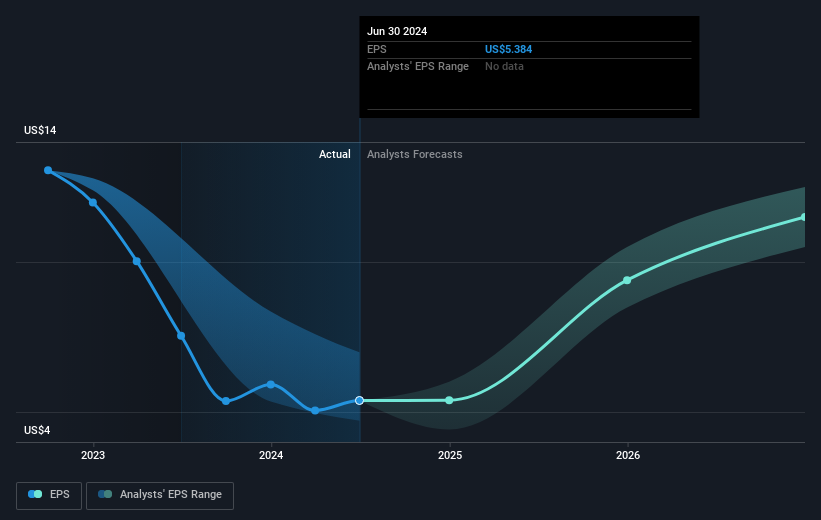
During five years of share price growth, ArcBest achieved compound earnings per share (EPS) growth of 10% per year. This EPS growth is slower than the share price growth of 30% per year, over the same period. This suggests that market participants hold the company in higher regard, these days. And that's hardly shocking given the track record of growth.
The company's earnings per share (over time) is depicted in the image below (click to see the exact numbers).
We like that insiders have been buying shares in the last twelve months. Even so, future earnings will be far more important to whether current shareholders make money. Before buying or selling a stock, we always recommend a close examination of historic growth trends, available here..
What About Dividends?
As well as measuring the share price return, investors should also consider the total shareholder return (TSR). The TSR incorporates the value of any spin-offs or discounted capital raisings, along with any dividends, based on the assumption that the dividends are reinvested. It's fair to say that the TSR gives a more complete picture for stocks that pay a dividend. As it happens, ArcBest's TSR for the last 5 years was 281%, which exceeds the share price return mentioned earlier. This is largely a result of its dividend payments!
A Different Perspective
ArcBest shareholders are down 6.9% for the year (even including dividends), but the market itself is up 16%. Even the share prices of good stocks drop sometimes, but we want to see improvements in the fundamental metrics of a business, before getting too interested. Longer term investors wouldn't be so upset, since they would have made 31%, each year, over five years. If the fundamental data continues to indicate long term sustainable growth, the current sell-off could be an opportunity worth considering. Investors who like to make money usually check up on insider purchases, such as the price paid, and total amount bought. You can find out about the insider purchases of ArcBest by clicking this link.
ArcBest is not the only stock insiders are buying. So take a peek at this free list of small cap companies at attractive valuations which insiders have been buying.
Please note, the market returns quoted in this article reflect the market weighted average returns of stocks that currently trade on American exchanges.
New: Manage All Your Stock Portfolios in One Place
We've created the ultimate portfolio companion for stock investors, and it's free.
• Connect an unlimited number of Portfolios and see your total in one currency
• Be alerted to new Warning Signs or Risks via email or mobile
• Track the Fair Value of your stocks
Have feedback on this article? Concerned about the content? Get in touch with us directly. Alternatively, email editorial-team (at) simplywallst.com.
This article by Simply Wall St is general in nature. We provide commentary based on historical data and analyst forecasts only using an unbiased methodology and our articles are not intended to be financial advice. It does not constitute a recommendation to buy or sell any stock, and does not take account of your objectives, or your financial situation. We aim to bring you long-term focused analysis driven by fundamental data. Note that our analysis may not factor in the latest price-sensitive company announcements or qualitative material. Simply Wall St has no position in any stocks mentioned.
About NasdaqGS:ARCB
ArcBest
An integrated logistics company, engages in the provision of ground, air, and ocean transportation solutions.
Flawless balance sheet and undervalued.
