Stock Analysis


Eric Stang has been the CEO of Ooma, Inc. (NYSE:OOMA) since 2009, and this article will examine the executive's compensation with respect to the overall performance of the company. This analysis will also look to assess whether the CEO is appropriately paid, considering recent earnings growth and investor returns for Ooma.
View our latest analysis for Ooma
How Does Total Compensation For Eric Stang Compare With Other Companies In The Industry?
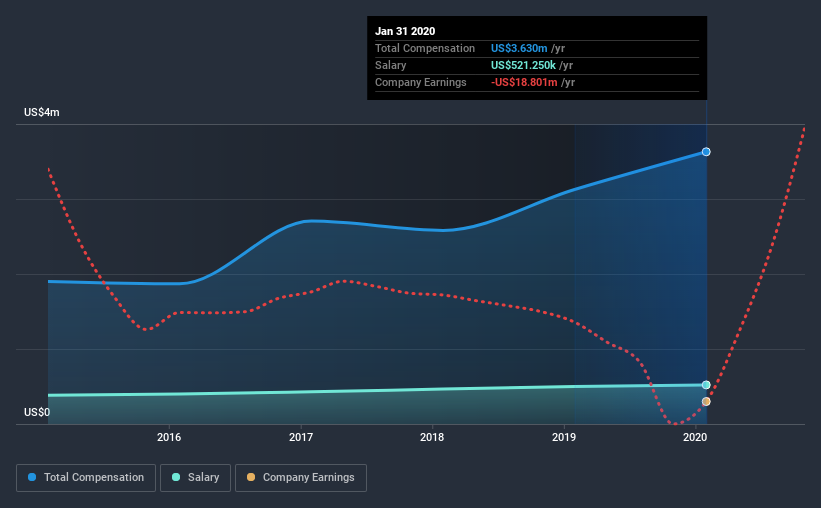
According to our data, Ooma, Inc. has a market capitalization of US$327m, and paid its CEO total annual compensation worth US$3.6m over the year to January 2020. That's a notable increase of 16% on last year. While this analysis focuses on total compensation, it's worth acknowledging that the salary portion is lower, valued at US$521k.
For comparison, other companies in the same industry with market capitalizations ranging between US$200m and US$800m had a median total CEO compensation of US$1.9m. Hence, we can conclude that Eric Stang is remunerated higher than the industry median. Furthermore, Eric Stang directly owns US$14m worth of shares in the company, implying that they are deeply invested in the company's success.
| Component | 2020 | 2019 | Proportion (2020) |
| Salary | US$521k | US$501k | 14% |
| Other | US$3.1m | US$2.6m | 86% |
| Total Compensation | US$3.6m | US$3.1m | 100% |
Speaking on an industry level, nearly 28% of total compensation represents salary, while the remainder of 72% is other remuneration. In Ooma's case, non-salary compensation represents a greater slice of total remuneration, in comparison to the broader industry. If non-salary compensation dominates total pay, it's an indicator that the executive's salary is tied to company performance.
Ooma, Inc.'s Growth
Ooma, Inc.'s earnings per share (EPS) grew 9.9% per year over the last three years. In the last year, its revenue is up 13%.
We would argue that the modest growth in revenue is a notable positive. And the modest growth in EPS isn't bad, either. So while performance isn't amazing, we think it really does seem quite respectable. Historical performance can sometimes be a good indicator on what's coming up next but if you want to peer into the company's future you might be interested in this free visualization of analyst forecasts.
Has Ooma, Inc. Been A Good Investment?
Ooma, Inc. has served shareholders reasonably well, with a total return of 19% over three years. But they probably don't want to see the CEO paid more than is normal for companies around the same size.
In Summary...
As we touched on above, Ooma, Inc. is currently paying its CEO higher than the median pay for CEOs of companies belonging to the same industry and with similar market capitalizations. But the company lacks EPS growth, and returns to shareholders are less than stellar, over the last three years. We'd stop short of saying CEO pay is inappropriate, but we'd like to see healthier business growth from the company, moving forward.
CEO compensation can have a massive impact on performance, but it's just one element. We've identified 1 warning sign for Ooma that investors should be aware of in a dynamic business environment.
Arguably, business quality is much more important than CEO compensation levels. So check out this free list of interesting companies that have HIGH return on equity and low debt.
If you’re looking to trade Ooma, open an account with the lowest-cost* platform trusted by professionals, Interactive Brokers. Their clients from over 200 countries and territories trade stocks, options, futures, forex, bonds and funds worldwide from a single integrated account. Promoted
Valuation is complex, but we're helping make it simple.
Find out whether Ooma is potentially over or undervalued by checking out our comprehensive analysis, which includes fair value estimates, risks and warnings, dividends, insider transactions and financial health.
View the Free AnalysisThis article by Simply Wall St is general in nature. It does not constitute a recommendation to buy or sell any stock, and does not take account of your objectives, or your financial situation. We aim to bring you long-term focused analysis driven by fundamental data. Note that our analysis may not factor in the latest price-sensitive company announcements or qualitative material. Simply Wall St has no position in any stocks mentioned.
*Interactive Brokers Rated Lowest Cost Broker by StockBrokers.com Annual Online Review 2020
Have feedback on this article? Concerned about the content? Get in touch with us directly. Alternatively, email editorial-team (at) simplywallst.com.
About NYSE:OOMA
Ooma
Provides communications services and related technologies for businesses and consumers in the United States and Canada.
Very undervalued with excellent balance sheet.
