
Advertisement
- United States
- /
- Wireless Telecom
- /
- NasdaqCM:VEON
Here's Why VEON (NASDAQ:VEON) Has A Meaningful Debt Burden
Legendary fund manager Li Lu (who Charlie Munger backed) once said, 'The biggest investment risk is not the volatility of prices, but whether you will suffer a permanent loss of capital.' So it seems the smart money knows that debt - which is usually involved in bankruptcies - is a very important factor, when you assess how risky a company is. As with many other companies VEON Ltd. (NASDAQ:VEON) makes use of debt. But the real question is whether this debt is making the company risky.
Our free stock report includes 2 warning signs investors should be aware of before investing in VEON. Read for free now.When Is Debt Dangerous?
Debt assists a business until the business has trouble paying it off, either with new capital or with free cash flow. In the worst case scenario, a company can go bankrupt if it cannot pay its creditors. However, a more common (but still painful) scenario is that it has to raise new equity capital at a low price, thus permanently diluting shareholders. Of course, the upside of debt is that it often represents cheap capital, especially when it replaces dilution in a company with the ability to reinvest at high rates of return. The first thing to do when considering how much debt a business uses is to look at its cash and debt together.
How Much Debt Does VEON Carry?
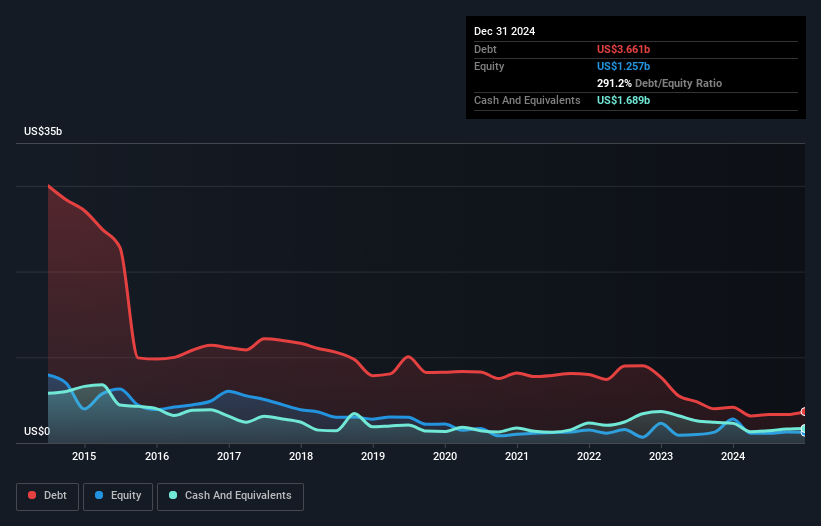
The image below, which you can click on for greater detail, shows that VEON had debt of US$3.66b at the end of December 2024, a reduction from US$4.18b over a year. However, it also had US$1.69b in cash, and so its net debt is US$1.97b.
A Look At VEON's Liabilities
The latest balance sheet data shows that VEON had liabilities of US$3.65b due within a year, and liabilities of US$3.13b falling due after that. Offsetting this, it had US$1.69b in cash and US$463.0m in receivables that were due within 12 months. So its liabilities outweigh the sum of its cash and (near-term) receivables by US$4.63b.
The deficiency here weighs heavily on the US$2.99b company itself, as if a child were struggling under the weight of an enormous back-pack full of books, his sports gear, and a trumpet. So we definitely think shareholders need to watch this one closely. After all, VEON would likely require a major re-capitalisation if it had to pay its creditors today.
See our latest analysis for VEON
We use two main ratios to inform us about debt levels relative to earnings. The first is net debt divided by earnings before interest, tax, depreciation, and amortization (EBITDA), while the second is how many times its earnings before interest and tax (EBIT) covers its interest expense (or its interest cover, for short). This way, we consider both the absolute quantum of the debt, as well as the interest rates paid on it.
VEON has a very low debt to EBITDA ratio of 1.2 so it is strange to see weak interest coverage, with last year's EBIT being only 2.2 times the interest expense. So while we're not necessarily alarmed we think that its debt is far from trivial. Sadly, VEON's EBIT actually dropped 5.5% in the last year. If that earnings trend continues then its debt load will grow heavy like the heart of a polar bear watching its sole cub. There's no doubt that we learn most about debt from the balance sheet. But it is future earnings, more than anything, that will determine VEON's ability to maintain a healthy balance sheet going forward. So if you're focused on the future you can check out this free report showing analyst profit forecasts.
Finally, while the tax-man may adore accounting profits, lenders only accept cold hard cash. So the logical step is to look at the proportion of that EBIT that is matched by actual free cash flow. Over the last three years, VEON actually produced more free cash flow than EBIT. That sort of strong cash generation warms our hearts like a puppy in a bumblebee suit.
Our View
To be frank both VEON's interest cover and its track record of staying on top of its total liabilities make us rather uncomfortable with its debt levels. But at least it's pretty decent at converting EBIT to free cash flow; that's encouraging. Looking at the balance sheet and taking into account all these factors, we do believe that debt is making VEON stock a bit risky. Some people like that sort of risk, but we're mindful of the potential pitfalls, so we'd probably prefer it carry less debt. There's no doubt that we learn most about debt from the balance sheet. However, not all investment risk resides within the balance sheet - far from it. Be aware that VEON is showing 2 warning signs in our investment analysis , and 1 of those doesn't sit too well with us...
When all is said and done, sometimes its easier to focus on companies that don't even need debt. Readers can access a list of growth stocks with zero net debt 100% free, right now.
New: Manage All Your Stock Portfolios in One Place
We've created the ultimate portfolio companion for stock investors, and it's free.
• Connect an unlimited number of Portfolios and see your total in one currency
• Be alerted to new Warning Signs or Risks via email or mobile
• Track the Fair Value of your stocks
Have feedback on this article? Concerned about the content? Get in touch with us directly. Alternatively, email editorial-team (at) simplywallst.com.
This article by Simply Wall St is general in nature. We provide commentary based on historical data and analyst forecasts only using an unbiased methodology and our articles are not intended to be financial advice. It does not constitute a recommendation to buy or sell any stock, and does not take account of your objectives, or your financial situation. We aim to bring you long-term focused analysis driven by fundamental data. Note that our analysis may not factor in the latest price-sensitive company announcements or qualitative material. Simply Wall St has no position in any stocks mentioned.
About NasdaqCM:VEON
VEON
A digital operator, provides telecommunications and digital services to corporate and individual customers in Pakistan, Ukraine, Kazakhstan, Uzbekistan, and Bangladesh.
Very undervalued with limited growth.
Similar Companies
Market Insights

Advertisement
Community Narratives
MicroVision will explode future revenue by 380.37% with a vision towards success
Fair Value US$60.00|98.4% undervalued
TH
Community Contributor
The Indispensable Artery for a New North American Economy
Fair Value CA$132.87|1.3% undervalued
TI
Community Contributor