Advertisement
- United States
- /
- Telecom Services and Carriers
- /
- NasdaqGS:CMCSA
Is Comcast (CMCSA) Offering Long Term Value After Multi Year Share Price Weakness

Reviewed by Bailey Pemberton
- If you are wondering whether Comcast's current share price reflects its underlying value, this breakdown is designed to help you make sense of what you are paying for.
- The stock last closed at US$31.57, with returns of 0.6% over 7 days, 13.5% over 30 days, 6.9% year to date, and a 0.9% decline over 1 year, plus longer term returns of a 4.8% decline over 3 years and a 25.1% decline over 5 years.
- These moves sit against a backdrop of ongoing interest in Comcast's broadband and media footprint, with investors considering how its mix of cable, streaming and content might affect future cash flows. The share price history provides useful context; however, what really matters is how those expectations compare with what the business may reasonably deliver over time.
- On Simply Wall St's 6 point valuation checklist, Comcast scores a 5 out of 6 for being assessed as undervalued. Next we will walk through the key valuation approaches behind that, then finish by looking at a broader way to think about what the stock could be worth.
Find out why Comcast's -0.9% return over the last year is lagging behind its peers.
Approach 1: Comcast Discounted Cash Flow (DCF) Analysis
A DCF model takes estimates of the cash a business could generate in the future, then discounts those projected cash flows back into today’s dollars to arrive at an intrinsic value per share.
For Comcast, Simply Wall St uses a 2 Stage Free Cash Flow to Equity model built on cash flow projections. The latest twelve month free cash flow is about $18.4b. Analyst inputs run through 2030, with projected free cash flow for that year of $15.7b, and further years extrapolated by Simply Wall St rather than based on additional analyst estimates.
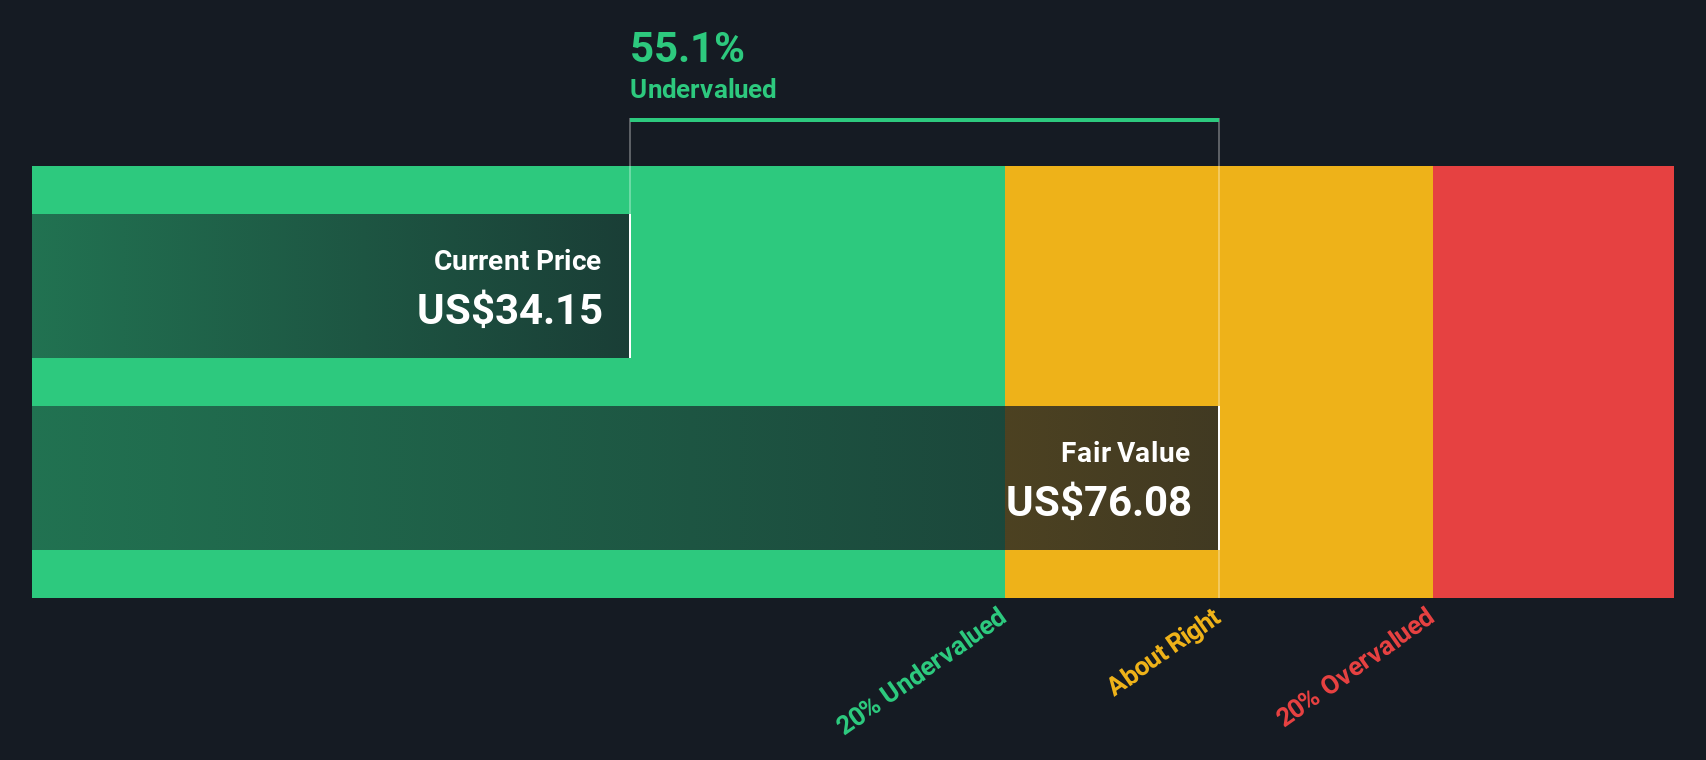
On this basis, the model arrives at an estimated intrinsic value of US$83.14 per share. Compared with the recent share price of US$31.57, this implies an intrinsic discount of 62.0%, which indicates that the shares are trading well below the DCF estimate of underlying value.
Result: UNDERVALUED
Our Discounted Cash Flow (DCF) analysis suggests Comcast is undervalued by 62.0%. Track this in your watchlist or portfolio, or discover 53 more high quality undervalued stocks.
Approach 2: Comcast Price vs Earnings
For profitable companies like Comcast, the P/E ratio is a straightforward way to think about value because it links what you pay per share to the earnings the business is currently generating. In general, higher growth expectations or lower perceived risk can justify a higher “normal” P/E, while slower growth or higher risk usually lines up with a lower P/E.
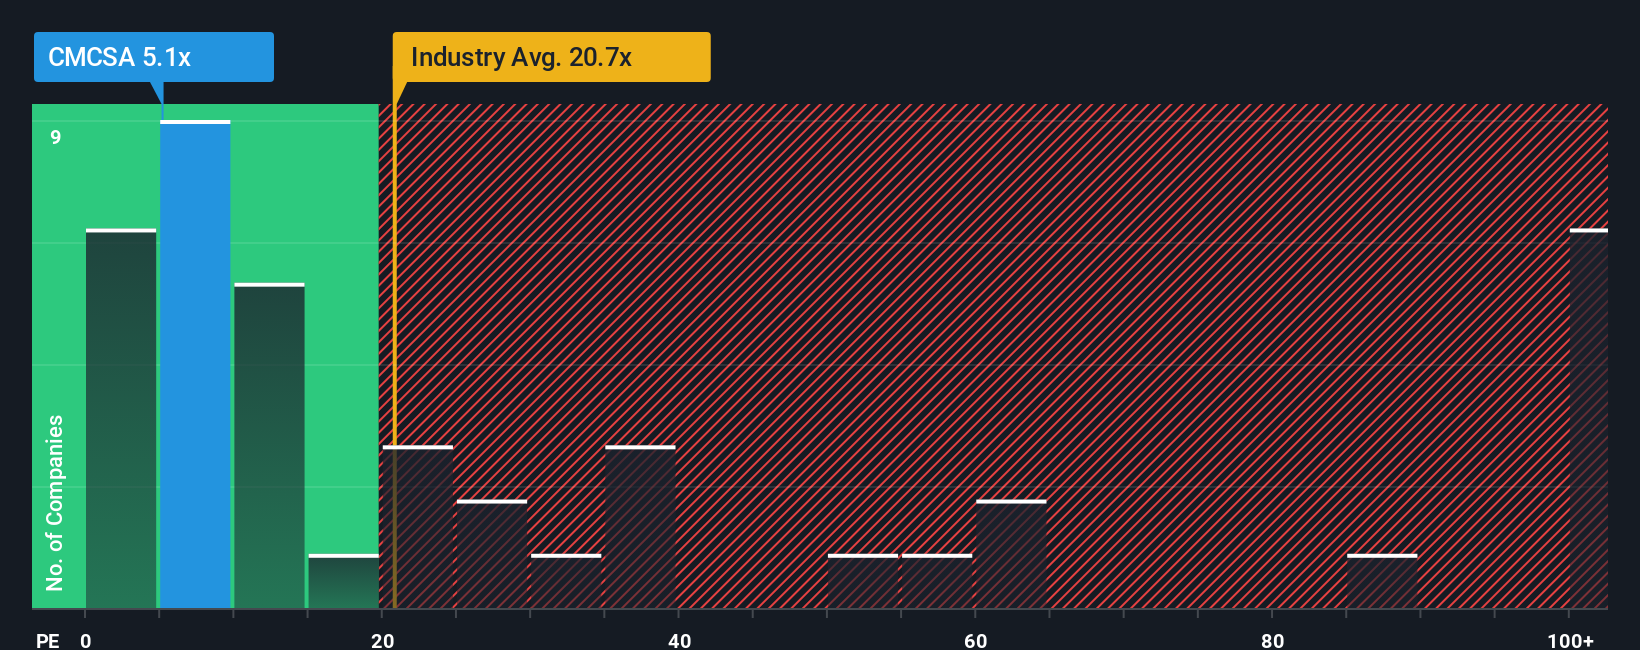
Comcast currently trades on a P/E of 5.68x. That sits below the Telecom industry average P/E of 16.67x and also below the peer group average of 7.11x. Simply Wall St’s Fair Ratio metric goes a step further by estimating what Comcast’s P/E might be given factors such as its earnings growth profile, profit margins, industry, market cap and risk characteristics. For Comcast, this Fair Ratio is 10.08x.
This Fair Ratio can be more informative than just lining Comcast up against peers or the wider industry because it is tailored to the company’s own fundamentals rather than broad group averages. Comparing Comcast’s current P/E of 5.68x with the Fair Ratio of 10.08x indicates that the shares are trading below this implied level.
Result: UNDERVALUED
P/E ratios tell one story, but what if the real opportunity lies elsewhere? Start investing in legacies, not executives. Discover our 23 top founder-led companies.
Upgrade Your Decision Making: Choose your Comcast Narrative
Earlier we mentioned that there is an even better way to understand valuation. Let us introduce you to Narratives, which are simple stories you create on Simply Wall St’s Community page that link your view of Comcast’s business to a set of revenue, earnings and margin assumptions. These are then turned into a financial forecast, and then into a Fair Value you can compare with today’s price to decide whether the stock looks attractive or not. Each Narrative updates automatically when new news or earnings arrive. For example, a cautious Comcast investor might build a story around a US$31 Fair Value that reflects flat to declining broadband, pressured media margins and a future P/E near 11.6x. A more optimistic investor might build a story closer to a US$49.43 Fair Value that leans on broadband reset, parks growth and a future P/E around 15x. You can see both side by side to choose which one, if either, fits your own view.
For Comcast however we will make it really easy for you with previews of two leading Comcast narratives.
Here is how a more optimistic and a more cautious Comcast story compare side by side, using the same framework you have seen above.
Fair value in this bullish narrative: US$43.62 per share
Implied discount to this fair value at the last close of US$31.57: about 27.6%
Assumed long run revenue growth in this narrative: 1.47% per year
- Frames Comcast as a broadband, parks and media group where simplified bundles, AI supported home connectivity and Epic Universe style parks projects support margins, retention and free cash flow over time.
- Assumes the Versant spin off, next generation broadband investment and a unified NBC and Peacock content approach can support earnings quality, recurring revenue and a future P/E multiple that sits above today’s level.
- Highlights risks around cord cutting, broadband competition, media rights costs and regulation, but still arrives at a fair value of about US$43.62 based on trimmed revenue growth, a slightly higher discount rate and a lower future P/E of 13.33x.
Fair value in this bearish narrative: US$23.85 per share
Implied premium to this fair value at the last close of US$31.57: about 32.4%
Assumed long run revenue change in this narrative: 0.24% annual decline
- Focuses on pressure in broadband and legacy media from market saturation, cord cutting, digital ad shifts and tougher pricing, with Warner Bros related acquisition efforts adding further execution and regulatory risk.
- Assumes rising content and sports rights costs, heavy capital spending on broadband and parks and ongoing regulatory scrutiny put a lid on margins, free cash flow and the ability to return capital to shareholders.
- Brings these views together into a fair value of about US$23.85, using softer revenue assumptions, a slightly higher discount rate of 8.28% and a lower future P/E of 10.10x that sits below many current analyst targets.
Both narratives use the same building blocks. They just plug in different revenue, margin and P/E assumptions and apply a similar discount rate. Your job is to decide which story, if either, feels closer to how you see Comcast’s broadband, media and parks business playing out over time.
If you want to see how other investors are joining the dots between these kinds of inputs and their own fair values for Comcast, it is worth spending a few minutes with Curious how numbers become stories that shape markets? Explore Community Narratives and seeing how your view compares.
Do you think there's more to the story for Comcast? Head over to our Community to see what others are saying!

This article by Simply Wall St is general in nature. We provide commentary based on historical data and analyst forecasts only using an unbiased methodology and our articles are not intended to be financial advice. It does not constitute a recommendation to buy or sell any stock, and does not take account of your objectives, or your financial situation. We aim to bring you long-term focused analysis driven by fundamental data. Note that our analysis may not factor in the latest price-sensitive company announcements or qualitative material. Simply Wall St has no position in any stocks mentioned.
New: AI Stock Screener & Alerts
Our new AI Stock Screener scans the market every day to uncover opportunities.
• Dividend Powerhouses (3%+ Yield)
• Undervalued Small Caps with Insider Buying
• High growth Tech and AI Companies
Or build your own from over 50 metrics.
Have feedback on this article? Concerned about the content? Get in touch with us directly. Alternatively, email editorial-team@simplywallst.com
About NasdaqGS:CMCSA
Comcast
Operates as a media and technology company worldwide.
6 star dividend payer and undervalued.
Similar Companies
Market Insights


Advertisement
Weekly Picks
CE


Ceazar on Eva Live ·
This small cap is building the AI workforce of the future
Fair Value:US$7.4351.3% undervalued
89 followersusers have followed this narrative
0 commentsusers have commented on this narrative
17 likesusers have liked this narrative
TR


tripledub on lululemon athletica ·
Lululemon Got Boring Right About the Time It Got Cheap. That's Usually the Point
Fair Value:US$22042.2% undervalued
27 followersusers have followed this narrative
6 commentsusers have commented on this narrative
30 likesusers have liked this narrative
WO


woodworthfund on Kraft Heinz ·
Kraft Heinz (KHC): Less Drama, More Ketchup
Fair Value:US$3532.0% undervalued
9 followersusers have followed this narrative
0 commentsusers have commented on this narrative
2 likesusers have liked this narrative
CA


Canderous on PetroTal ·
Beyond 2026, Beyond a Double
Fair Value:CA$1.8166.9% undervalued
30 followersusers have followed this narrative
0 commentsusers have commented on this narrative
6 likesusers have liked this narrative
Recently Updated Narratives
JO

Joe222 on Encore Capital Group ·
ECPG is a solid company
Fair Value:US$120.3833.4% undervalued
6 followersusers have followed this narrative
0 commentsusers have commented on this narrative
0 likesusers have liked this narrative
RO


RockeTeller on Aftermath Silver ·
Aftermath Silver, A 35% Insider-Aligned Silver Stock With a Giant Critical Metals Twist
Fair Value:CA$30.3797.5% undervalued
5 followersusers have followed this narrative
2 commentsusers have commented on this narrative
1 likeusers have liked this narrative
RO

RockeTeller on Selkirk Copper Mines ·
Selkirk Copper, Ex-Teck + 87% Hit Rate Maybe The Highest-Conviction Copper Restart in Canada Now
Fair Value:CA$21.7491.3% undervalued
2 followersusers have followed this narrative
0 commentsusers have commented on this narrative
1 likeusers have liked this narrative
Popular Narratives
GO

GoldenSands on QuantumScape ·
QuantumScape: A Mispriced Deep‑Tech Inflection Point With Multi‑Billion‑Dollar Optionality
Fair Value:US$8590.4% undervalued
115 followersusers have followed this narrative
2 commentsusers have commented on this narrative
31 likesusers have liked this narrative
AN


AnalystConsensusTarget on NVIDIA ·
NVDA: Expanding AI Demand Will Drive Major Data Center Investments Through 2026
Fair Value:US$268.6119.8% undervalued
1193 followersusers have followed this narrative
7 commentsusers have commented on this narrative
34 likesusers have liked this narrative
TR
tripledub on lululemon athletica ·
Lululemon Got Boring Right About the Time It Got Cheap. That's Usually the Point
Fair Value:US$22042.2% undervalued
27 followersusers have followed this narrative
6 commentsusers have commented on this narrative
30 likesusers have liked this narrative

