Advertisement
- United States
- /
- Telecom Services and Carriers
- /
- NasdaqGS:ASTS
AST SpaceMobile (ASTS): Valuation in Focus After Landmark 10-Year Satellite Deal With STC Group

Simply Wall St
Reviewed by Simply Wall St
AST SpaceMobile (ASTS) jumped into the spotlight after announcing a 10-year commercial agreement with STC Group to deliver direct-to-device satellite mobile connectivity across Saudi Arabia and select markets in the region.
See our latest analysis for AST SpaceMobile.
The market clearly took notice of AST SpaceMobile’s landmark agreement with STC Group and the company’s recent $161 million equity raise. While shares have pulled back 11% in the last day after a sharp run, the year-to-date share price return sits at a remarkable 229%. Long-term total shareholder returns have been even more impressive, fueling growing optimism around the company’s growth trajectory.
If bold breakthroughs in satellite connectivity have you watching what else is accelerating, now is a smart time to check out See the full list for free.
With shares having soared on breakthrough news and a record year of returns, investors are left wondering if there is still an upside to capture here, or if all the future growth is already reflected in the price.
Price-to-Book of 22.8x: Is it justified?
With AST SpaceMobile’s last close at $71.15, its price-to-book ratio sits at 22.8x, making the stock appear significantly more expensive than both its peers and the industry average.
The price-to-book ratio compares a company's market value to its balance sheet equity. This measure helps highlight how much investors are paying versus the company’s net assets. For a capital-intensive sector like telecom, this metric is often used to gauge whether the market is pricing in future growth or over-optimism.
In this case, AST SpaceMobile’s price-to-book ratio is over four times the peer average of 5.4x and far exceeds the US Telecom industry average of 1.2x. Such a premium suggests investors expect transformative growth, but it raises questions as to whether those expectations are sustainable given the company’s lack of meaningful revenue and recurring losses.
See what the numbers say about this price — find out in our valuation breakdown.
Result: Price-to-Book of 22.8x (OVERVALUED)
However, persistent losses and a price below analyst targets highlight real risks. These factors could challenge the current optimism around AST SpaceMobile’s valuation.
Find out about the key risks to this AST SpaceMobile narrative.
Another View: What Does Our DCF Model Say?
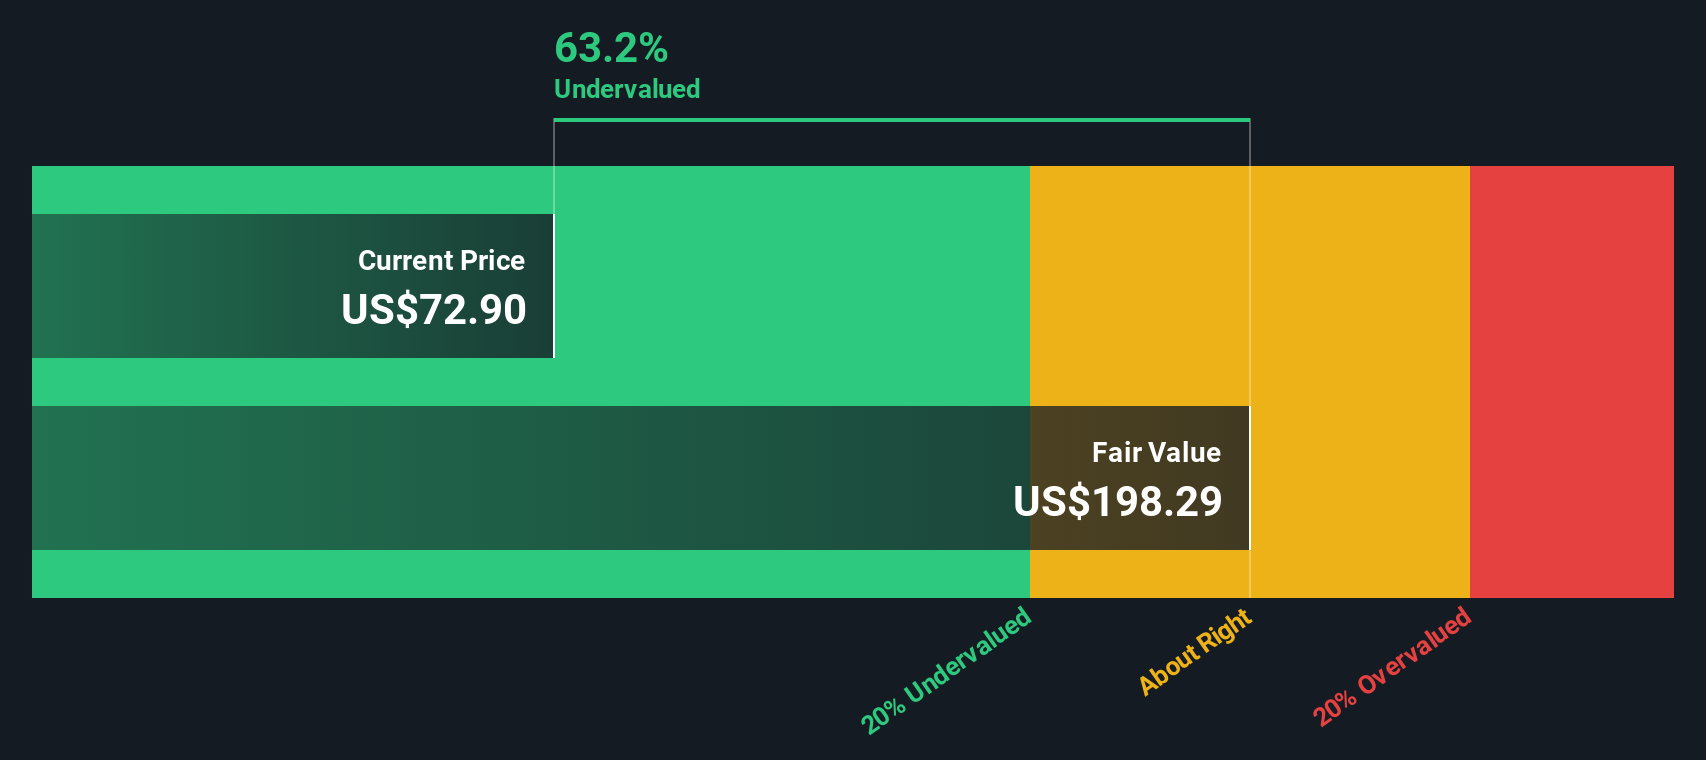
The SWS DCF model takes a longer-term perspective and estimates AST SpaceMobile’s fair value at $196.46. This suggests shares are actually undervalued by more than 60% at current levels. This sharply contrasts with the expensive picture painted by the price-to-book ratio and highlights how future growth expectations can dramatically shift valuation stories.
Look into how the SWS DCF model arrives at its fair value.
Simply Wall St performs a discounted cash flow (DCF) on every stock in the world every day (check out AST SpaceMobile for example). We show the entire calculation in full. You can track the result in your watchlist or portfolio and be alerted when this changes, or use our stock screener to discover 843 undervalued stocks based on their cash flows. If you save a screener we even alert you when new companies match - so you never miss a potential opportunity.
Build Your Own AST SpaceMobile Narrative
For those who want to dig deeper or have a different perspective, you can explore the numbers and develop your own take in just a few minutes. Do it your way
A great starting point for your AST SpaceMobile research is our analysis highlighting 2 key rewards and 4 important warning signs that could impact your investment decision.
Looking for more investment ideas?
Don’t wait for the next big headline. Get ahead by putting the latest investing opportunities at your fingertips with the Simply Wall St Screener.
- Capture rapid growth by checking out these 26 AI penny stocks, where artificial intelligence opens doors to powerful gains and the companies setting the pace in tomorrow's economy.
- Target unbeatable value with these 843 undervalued stocks based on cash flows, featuring high-quality stocks trading below their worth and primed for future potential.
- Strengthen your income strategy by browsing these 18 dividend stocks with yields > 3%, highlighting reliable picks offering consistent yields above 3% for steady cash flow.
This article by Simply Wall St is general in nature. We provide commentary based on historical data and analyst forecasts only using an unbiased methodology and our articles are not intended to be financial advice. It does not constitute a recommendation to buy or sell any stock, and does not take account of your objectives, or your financial situation. We aim to bring you long-term focused analysis driven by fundamental data. Note that our analysis may not factor in the latest price-sensitive company announcements or qualitative material. Simply Wall St has no position in any stocks mentioned.
New: Manage All Your Stock Portfolios in One Place
We've created the ultimate portfolio companion for stock investors, and it's free.
• Connect an unlimited number of Portfolios and see your total in one currency
• Be alerted to new Warning Signs or Risks via email or mobile
• Track the Fair Value of your stocks
Have feedback on this article? Concerned about the content? Get in touch with us directly. Alternatively, email editorial-team@simplywallst.com
About NasdaqGS:ASTS
AST SpaceMobile
Designs and develops the constellation of BlueBird satellites in the United States.
Exceptional growth potential with excellent balance sheet.
Similar Companies
Market Insights

Advertisement
Community Narratives
The company that turned a verb into a global necessity and basically runs the modern internet, digital ads, smartphones, maps, and AI.
Fair Value US$300.00|5.4% undervalued
OS
Community Contributor
Flowers Foods Pays A Fair Price For Health
Fair Value US$16.12|26.3% undervalued
NV
Community Contributor
TMX Group will thrive with 33.3% profit margin and enduring market moat
Fair Value CA$49.90|4.1% overvalued
LI
Community Contributor
The "Molecular Pencil": Why Beam's Technology is Built to Win
Fair Value US$65.01|62.7% undervalued
DA
Community Contributor