Stock Analysis


Key Insights
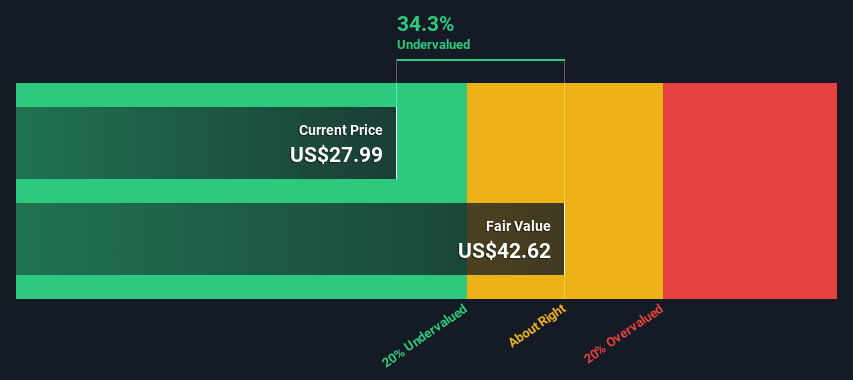
- Using the 2 Stage Free Cash Flow to Equity, HP fair value estimate is US$42.62
- HP's US$27.99 share price signals that it might be 34% undervalued
- Analyst price target for HPQ is US$30.48 which is 28% below our fair value estimate
Today we'll do a simple run through of a valuation method used to estimate the attractiveness of HP Inc. (NYSE:HPQ) as an investment opportunity by taking the expected future cash flows and discounting them to their present value. This will be done using the Discounted Cash Flow (DCF) model. Believe it or not, it's not too difficult to follow, as you'll see from our example!
We would caution that there are many ways of valuing a company and, like the DCF, each technique has advantages and disadvantages in certain scenarios. For those who are keen learners of equity analysis, the Simply Wall St analysis model here may be something of interest to you.
See our latest analysis for HP
The Method
We are going to use a two-stage DCF model, which, as the name states, takes into account two stages of growth. The first stage is generally a higher growth period which levels off heading towards the terminal value, captured in the second 'steady growth' period. To begin with, we have to get estimates of the next ten years of cash flows. Where possible we use analyst estimates, but when these aren't available we extrapolate the previous free cash flow (FCF) from the last estimate or reported value. We assume companies with shrinking free cash flow will slow their rate of shrinkage, and that companies with growing free cash flow will see their growth rate slow, over this period. We do this to reflect that growth tends to slow more in the early years than it does in later years.
Generally we assume that a dollar today is more valuable than a dollar in the future, and so the sum of these future cash flows is then discounted to today's value:
10-year free cash flow (FCF) estimate
| 2024 | 2025 | 2026 | 2027 | 2028 | 2029 | 2030 | 2031 | 2032 | 2033 | |
| Levered FCF ($, Millions) | US$3.30b | US$3.03b | US$3.21b | US$3.30b | US$3.33b | US$3.38b | US$3.44b | US$3.50b | US$3.57b | US$3.64b |
| Growth Rate Estimate Source | Analyst x6 | Analyst x3 | Analyst x1 | Analyst x1 | Est @ 1.04% | Est @ 1.40% | Est @ 1.64% | Est @ 1.82% | Est @ 1.94% | Est @ 2.02% |
| Present Value ($, Millions) Discounted @ 9.4% | US$3.0k | US$2.5k | US$2.5k | US$2.3k | US$2.1k | US$2.0k | US$1.8k | US$1.7k | US$1.6k | US$1.5k |
("Est" = FCF growth rate estimated by Simply Wall St)
Present Value of 10-year Cash Flow (PVCF) = US$21b
We now need to calculate the Terminal Value, which accounts for all the future cash flows after this ten year period. The Gordon Growth formula is used to calculate Terminal Value at a future annual growth rate equal to the 5-year average of the 10-year government bond yield of 2.2%. We discount the terminal cash flows to today's value at a cost of equity of 9.4%.
Terminal Value (TV)= FCF2033 × (1 + g) ÷ (r – g) = US$3.6b× (1 + 2.2%) ÷ (9.4%– 2.2%) = US$52b
Present Value of Terminal Value (PVTV)= TV / (1 + r)10= US$52b÷ ( 1 + 9.4%)10= US$21b
The total value is the sum of cash flows for the next ten years plus the discounted terminal value, which results in the Total Equity Value, which in this case is US$42b. The last step is to then divide the equity value by the number of shares outstanding. Compared to the current share price of US$28.0, the company appears quite good value at a 34% discount to where the stock price trades currently. Remember though, that this is just an approximate valuation, and like any complex formula - garbage in, garbage out.
The Assumptions
Now the most important inputs to a discounted cash flow are the discount rate, and of course, the actual cash flows. If you don't agree with these result, have a go at the calculation yourself and play with the assumptions. The DCF also does not consider the possible cyclicality of an industry, or a company's future capital requirements, so it does not give a full picture of a company's potential performance. Given that we are looking at HP as potential shareholders, the cost of equity is used as the discount rate, rather than the cost of capital (or weighted average cost of capital, WACC) which accounts for debt. In this calculation we've used 9.4%, which is based on a levered beta of 1.436. Beta is a measure of a stock's volatility, compared to the market as a whole. We get our beta from the industry average beta of globally comparable companies, with an imposed limit between 0.8 and 2.0, which is a reasonable range for a stable business.
SWOT Analysis for HP
- Debt is well covered by earnings and cashflows.
- Dividends are covered by earnings and cash flows.
- Earnings declined over the past year.
- Dividend is low compared to the top 25% of dividend payers in the Tech market.
- Annual earnings are forecast to grow for the next 4 years.
- Good value based on P/E ratio and estimated fair value.
- Total liabilities exceed total assets, which raises the risk of financial distress.
- Annual earnings are forecast to grow slower than the American market.
Looking Ahead:
Whilst important, the DCF calculation ideally won't be the sole piece of analysis you scrutinize for a company. The DCF model is not a perfect stock valuation tool. Instead the best use for a DCF model is to test certain assumptions and theories to see if they would lead to the company being undervalued or overvalued. For instance, if the terminal value growth rate is adjusted slightly, it can dramatically alter the overall result. Can we work out why the company is trading at a discount to intrinsic value? For HP, there are three additional aspects you should assess:
- Risks: We feel that you should assess the 5 warning signs for HP (1 can't be ignored!) we've flagged before making an investment in the company.
- Future Earnings: How does HPQ's growth rate compare to its peers and the wider market? Dig deeper into the analyst consensus number for the upcoming years by interacting with our free analyst growth expectation chart.
- Other Solid Businesses: Low debt, high returns on equity and good past performance are fundamental to a strong business. Why not explore our interactive list of stocks with solid business fundamentals to see if there are other companies you may not have considered!
PS. Simply Wall St updates its DCF calculation for every American stock every day, so if you want to find the intrinsic value of any other stock just search here.
Valuation is complex, but we're helping make it simple.
Find out whether HP is potentially over or undervalued by checking out our comprehensive analysis, which includes fair value estimates, risks and warnings, dividends, insider transactions and financial health.
View the Free AnalysisHave feedback on this article? Concerned about the content? Get in touch with us directly. Alternatively, email editorial-team (at) simplywallst.com.
This article by Simply Wall St is general in nature. We provide commentary based on historical data and analyst forecasts only using an unbiased methodology and our articles are not intended to be financial advice. It does not constitute a recommendation to buy or sell any stock, and does not take account of your objectives, or your financial situation. We aim to bring you long-term focused analysis driven by fundamental data. Note that our analysis may not factor in the latest price-sensitive company announcements or qualitative material. Simply Wall St has no position in any stocks mentioned.
About NYSE:HPQ
HP
Provides personal computing and other digital access devices, imaging and printing products, and related technologies, solutions, and services worldwide.
Undervalued average dividend payer.
