
Advertisement
We Think CTS (NYSE:CTS) Can Stay On Top Of Its Debt
Legendary fund manager Li Lu (who Charlie Munger backed) once said, 'The biggest investment risk is not the volatility of prices, but whether you will suffer a permanent loss of capital.' So it seems the smart money knows that debt - which is usually involved in bankruptcies - is a very important factor, when you assess how risky a company is. We can see that CTS Corporation (NYSE:CTS) does use debt in its business. But should shareholders be worried about its use of debt?
When Is Debt Dangerous?
Debt is a tool to help businesses grow, but if a business is incapable of paying off its lenders, then it exists at their mercy. In the worst case scenario, a company can go bankrupt if it cannot pay its creditors. However, a more usual (but still expensive) situation is where a company must dilute shareholders at a cheap share price simply to get debt under control. By replacing dilution, though, debt can be an extremely good tool for businesses that need capital to invest in growth at high rates of return. When we examine debt levels, we first consider both cash and debt levels, together.
Check out our latest analysis for CTS
What Is CTS's Net Debt?
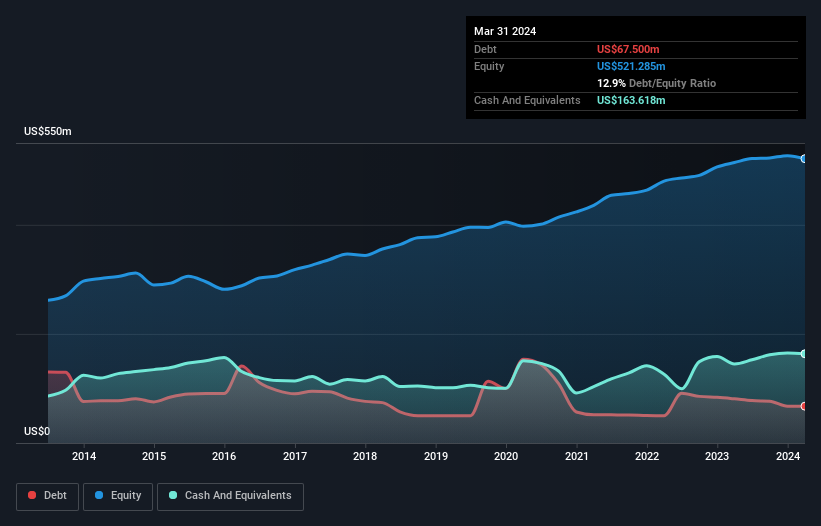
As you can see below, CTS had US$67.5m of debt at March 2024, down from US$80.9m a year prior. But on the other hand it also has US$163.6m in cash, leading to a US$96.1m net cash position.
How Healthy Is CTS' Balance Sheet?
We can see from the most recent balance sheet that CTS had liabilities of US$95.9m falling due within a year, and liabilities of US$115.6m due beyond that. On the other hand, it had cash of US$163.6m and US$80.7m worth of receivables due within a year. So it can boast US$32.7m more liquid assets than total liabilities.
This surplus suggests that CTS has a conservative balance sheet, and could probably eliminate its debt without much difficulty. Succinctly put, CTS boasts net cash, so it's fair to say it does not have a heavy debt load!
The modesty of its debt load may become crucial for CTS if management cannot prevent a repeat of the 23% cut to EBIT over the last year. When it comes to paying off debt, falling earnings are no more useful than sugary sodas are for your health. The balance sheet is clearly the area to focus on when you are analysing debt. But ultimately the future profitability of the business will decide if CTS can strengthen its balance sheet over time. So if you're focused on the future you can check out this free report showing analyst profit forecasts.
But our final consideration is also important, because a company cannot pay debt with paper profits; it needs cold hard cash. CTS may have net cash on the balance sheet, but it is still interesting to look at how well the business converts its earnings before interest and tax (EBIT) to free cash flow, because that will influence both its need for, and its capacity to manage debt. Over the last three years, CTS recorded free cash flow worth a fulsome 97% of its EBIT, which is stronger than we'd usually expect. That puts it in a very strong position to pay down debt.
Summing Up
While it is always sensible to investigate a company's debt, in this case CTS has US$96.1m in net cash and a decent-looking balance sheet. The cherry on top was that in converted 97% of that EBIT to free cash flow, bringing in US$82m. So we are not troubled with CTS's debt use. Above most other metrics, we think its important to track how fast earnings per share is growing, if at all. If you've also come to that realization, you're in luck, because today you can view this interactive graph of CTS's earnings per share history for free.
At the end of the day, it's often better to focus on companies that are free from net debt. You can access our special list of such companies (all with a track record of profit growth). It's free.
New: AI Stock Screener & Alerts
Our new AI Stock Screener scans the market every day to uncover opportunities.
• Dividend Powerhouses (3%+ Yield)
• Undervalued Small Caps with Insider Buying
• High growth Tech and AI Companies
Or build your own from over 50 metrics.
Have feedback on this article? Concerned about the content? Get in touch with us directly. Alternatively, email editorial-team (at) simplywallst.com.
This article by Simply Wall St is general in nature. We provide commentary based on historical data and analyst forecasts only using an unbiased methodology and our articles are not intended to be financial advice. It does not constitute a recommendation to buy or sell any stock, and does not take account of your objectives, or your financial situation. We aim to bring you long-term focused analysis driven by fundamental data. Note that our analysis may not factor in the latest price-sensitive company announcements or qualitative material. Simply Wall St has no position in any stocks mentioned.
About NYSE:CTS
CTS
Designs, manufactures, and sells sensors, connectivity components, and actuators in North America, Europe, and Asia.
Flawless balance sheet and good value.
Similar Companies
Market Insights

Advertisement
Community Narratives
MicroVision will explode future revenue by 380.37% with a vision towards success
Fair Value US$60.00|98.4% undervalued
TH
Community Contributor
The Indispensable Artery for a New North American Economy
Fair Value CA$132.87|1.3% undervalued
TI
Community Contributor