Advertisement
Is Amphenol Still Attractive After a 94% Price Surge and New Partnerships in 2025?

Simply Wall St
Reviewed by Bailey Pemberton
If you have been watching Amphenol’s stock lately, you might be asking yourself whether you have already missed the boat or if it is still worth stepping aboard. With shares closing most recently at $133.82 and logging a massive 94.3% gain over the past year, it is no stretch to say the company’s run has caught plenty of eyes. In fact, Amphenol’s share price is up nearly 400% over five years and has surged 6.5% just this past week alone, reflecting ongoing optimism from investors and perhaps a recalibration of how the market views its potential.
This momentum comes as the company’s products, critical connectors used in everything from data centers to automotive technologies, are increasingly in demand, particularly with global supply chains still working through lingering disruptions. News of fresh partnership agreements and expanding business lines has also helped boost market sentiment, signaling that Amphenol may be set to capture more value as digital infrastructure and electrification trends accelerate.
Still, when it comes to valuation, the numbers suggest a bit more caution. Out of six major measures we assess for undervaluation, Amphenol scores just 1, highlighting that it only checks one box as undervalued right now. That raises the key question: is this a case of a great company that is simply priced for perfection, or is there more upside left in the tank?
Let’s break down each valuation approach and see how things stack up. If you really want to know whether buying Amphenol makes sense, there is one smarter way of thinking about value that we will get to at the end.
Amphenol scores just 1/6 on our valuation checks. See what other red flags we found in the full valuation breakdown.
Approach 1: Amphenol Discounted Cash Flow (DCF) Analysis
The Discounted Cash Flow (DCF) model estimates a company's value by projecting its future cash flows and then discounting them back to reflect today's value. This approach seeks to capture the long-term earning power of a business based on its ability to generate free cash flow over time.
For Amphenol, current free cash flow stands at $3.67 billion, highlighting the company’s impressive scale even under current market conditions. Analysts offer direct forecasts up to 2029, with free cash flow expected to grow to $7.23 billion by the end of that year. For years beyond analyst estimates, projections are generated using assumed growth rates. This process ultimately leads to a projected $11.02 billion in free cash flow by 2035, with all figures quoted in dollars.
With these inputs, the DCF model arrives at an intrinsic value for Amphenol of $119.63 per share. Compared to its current price of $133.82, this suggests the stock is trading at an 11.9% premium to its calculated fair value. While signs of long-term growth are evident, the DCF model indicates the market is currently pricing in quite a bit of future optimism.
Result: OVERVALUED
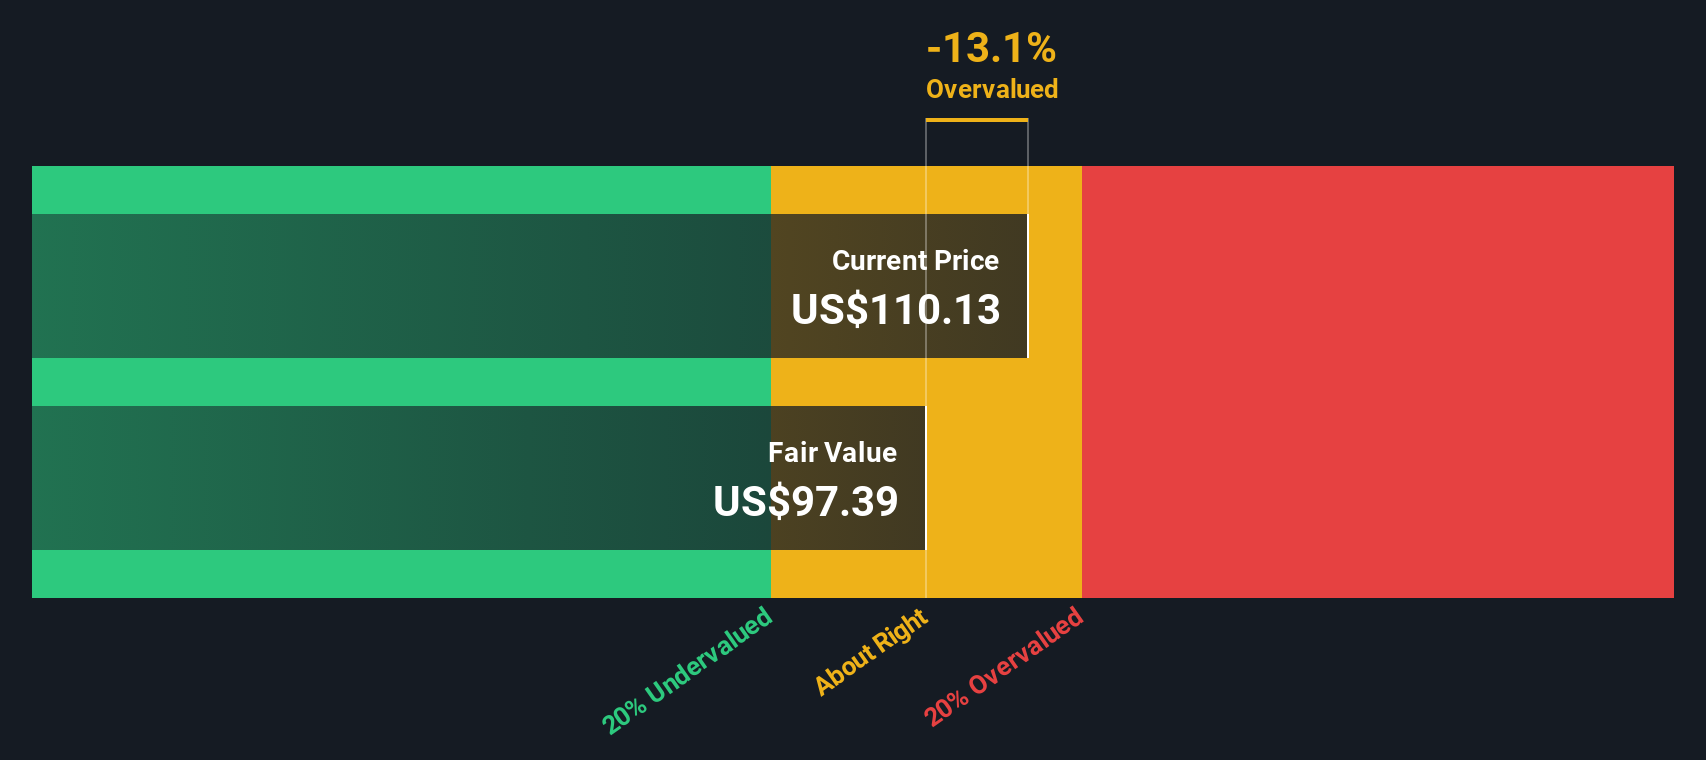
Our Discounted Cash Flow (DCF) analysis suggests Amphenol may be overvalued by 11.9%. Find undervalued stocks or create your own screener to find better value opportunities.
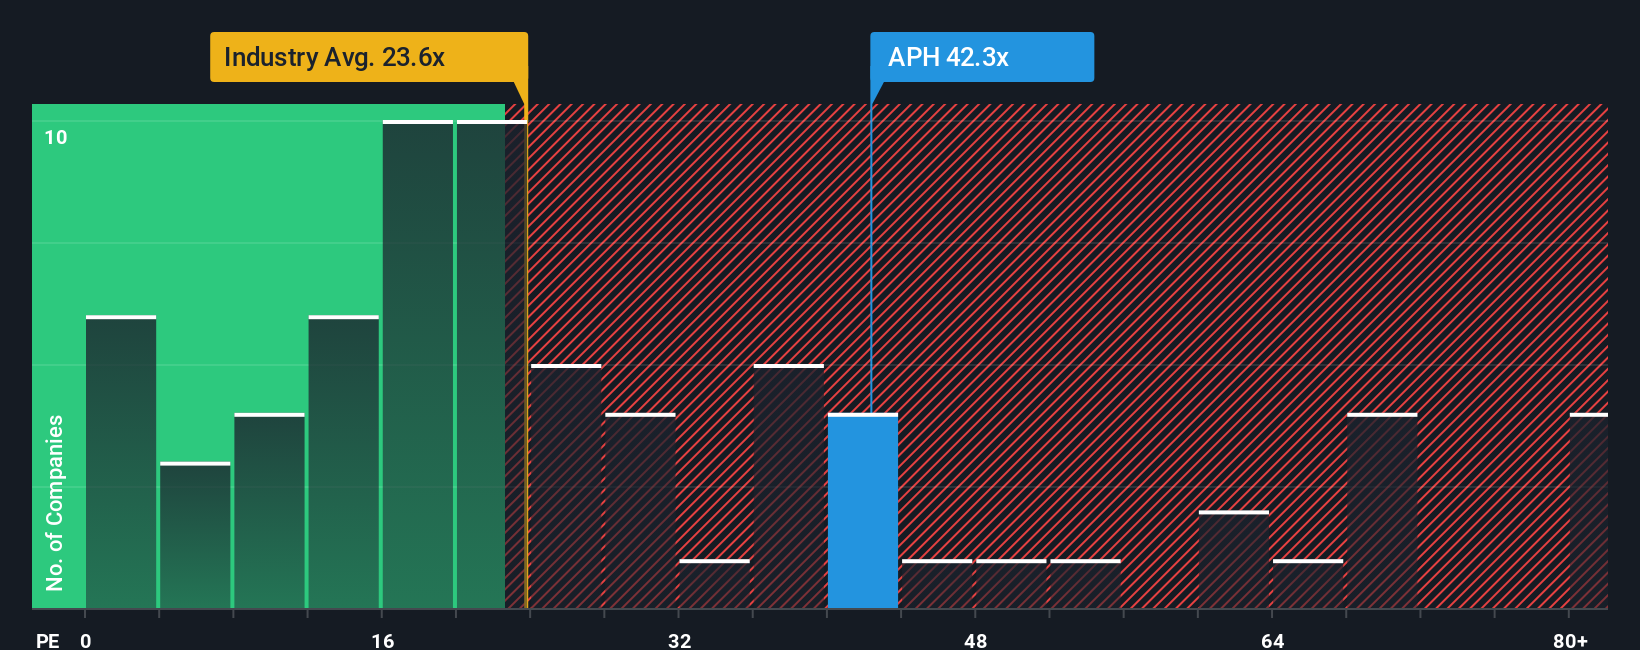
Approach 2: Amphenol Price vs Earnings (PE)
The Price-to-Earnings (PE) ratio is widely viewed as a sensible metric for valuing profitable companies like Amphenol because it weighs the current share price against earnings, reflecting both a company’s growth prospects and its risk profile. Investors often expect firms with higher growth potential or lower risk to command higher PE ratios, while companies experiencing slower growth or greater uncertainty tend to trade at lower multiples.
Amphenol’s current PE ratio stands at 42.7x, meaning investors are paying almost 43 times last year’s earnings for each share. For context, the average PE ratio among electronic industry peers is just 25.5x, and the peer average is 58.5x. Therefore, Amphenol is valued above the broader industry but below some closer comparables, highlighting the market’s strong optimism about its prospects.
To go beyond simple benchmarks, Simply Wall St uses a proprietary “Fair Ratio.” This is the multiple the company would typically deserve based on factors like its own earnings growth, profit margin, business risks, industry context, and market cap. The Fair Ratio is more instructive than a plain industry average because it adjusts for things that really matter when evaluating if a stock deserves a higher or lower valuation.
Amphenol’s Fair Ratio, according to Simply Wall St’s model, is 39.4x. This is just a short step down from its current PE of 42.7x, suggesting the stock is priced almost perfectly in line with its fundamentals, growth potential, and risk profile.
Result: ABOUT RIGHT
PE ratios tell one story, but what if the real opportunity lies elsewhere? Discover companies where insiders are betting big on explosive growth.
Upgrade Your Decision Making: Choose your Amphenol Narrative
Earlier we mentioned that there's an even better way to understand valuation, so let's introduce you to Narratives. A Narrative is a simple, accessible tool that empowers you to create your own investment story by connecting your personal outlook on a company, such as beliefs around its future growth or profitability, to a clear financial forecast and estimated fair value.
Narratives link Amphenol’s business story directly to numbers, allowing you to transparently record your unique assumptions about factors like revenue growth, future earnings, profit margins, and risk. On Simply Wall St’s Community page, millions of investors use Narratives to visualize their rationale, compare their projected fair value with the current share price, and decide when it might be smart to buy or sell.
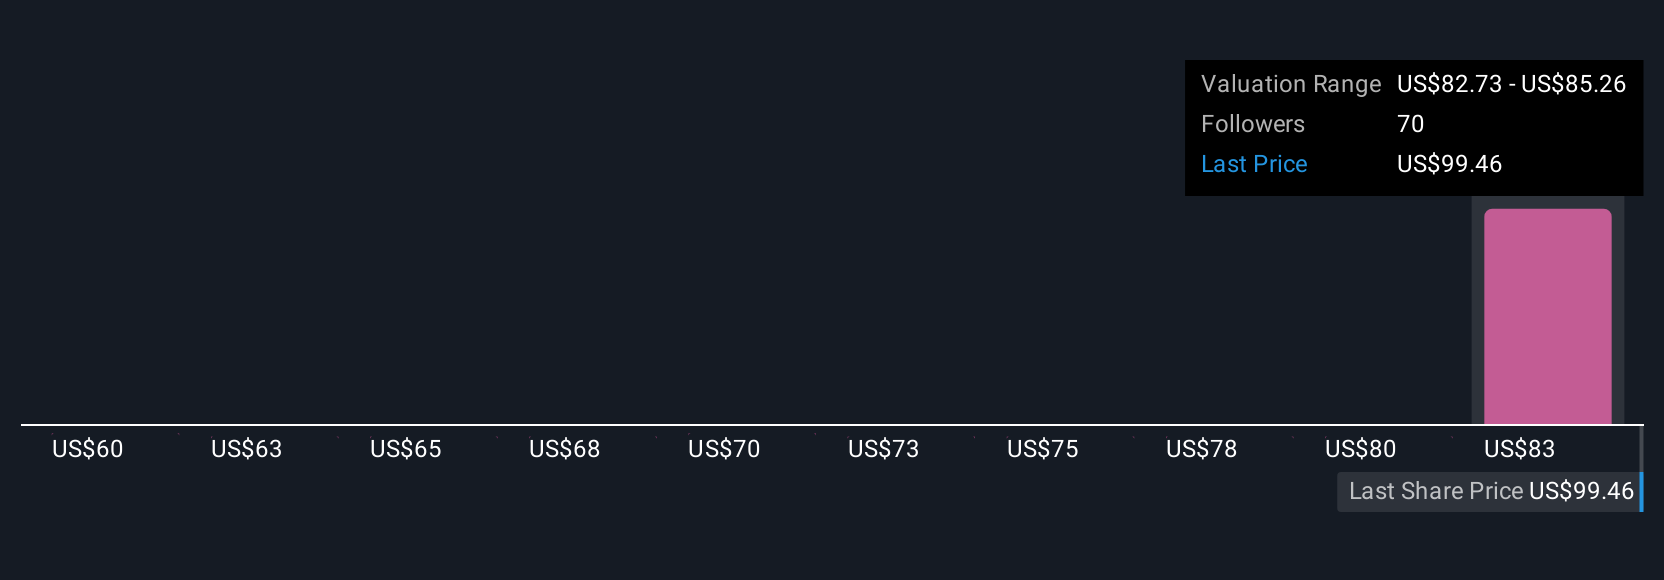
Best of all, Narratives update automatically when new information (like earnings results or news) emerges, so your analysis stays current with the market. For example, one Amphenol investor might see rapid AI-driven datacenter expansion and recent acquisitions as catalysts, forecasting a fair value as high as $139.29, while another might focus on integration and market risks, setting a fair value closer to $85, both anchored by their own story and expectations.
Do you think there's more to the story for Amphenol? Create your own Narrative to let the Community know!
This article by Simply Wall St is general in nature. We provide commentary based on historical data and analyst forecasts only using an unbiased methodology and our articles are not intended to be financial advice. It does not constitute a recommendation to buy or sell any stock, and does not take account of your objectives, or your financial situation. We aim to bring you long-term focused analysis driven by fundamental data. Note that our analysis may not factor in the latest price-sensitive company announcements or qualitative material. Simply Wall St has no position in any stocks mentioned.
New: Manage All Your Stock Portfolios in One Place
We've created the ultimate portfolio companion for stock investors, and it's free.
• Connect an unlimited number of Portfolios and see your total in one currency
• Be alerted to new Warning Signs or Risks via email or mobile
• Track the Fair Value of your stocks
Have feedback on this article? Concerned about the content? Get in touch with us directly. Alternatively, email editorial-team@simplywallst.com
About NYSE:APH
Amphenol
Designs, manufactures, and markets electrical, electronic, and fiber optic connectors in the United States, China, and internationally.
Outstanding track record with flawless balance sheet and pays a dividend.
Similar Companies
Market Insights

Advertisement
Community Narratives
Finding The True Value Of A Logistics Powerhouse
Fair Value US$95.21|8.4% undervalued
NV
Community Contributor
Paradigm Biopharmaceuticals Will Lead Osteoarthritis Treatment with Zilosul's FDA Success
Fair Value AU$5.50|92.1% undervalued
AM
Community Contributor
Barrick Mining (ABX:CA): A Gold Hedge against a U.S. Shutdown
Fair Value CA$60.00|24.2% undervalued
GM
Community Contributor