- United States
- /
- Electronic Equipment and Components
- /
- NasdaqCM:WETH
Not Many Are Piling Into Wetouch Technology Inc. (NASDAQ:WETH) Stock Yet As It Plummets 52%

To the annoyance of some shareholders, Wetouch Technology Inc. (NASDAQ:WETH) shares are down a considerable 52% in the last month, which continues a horrid run for the company. The last month has meant the stock is now only up 8.9% during the last year.
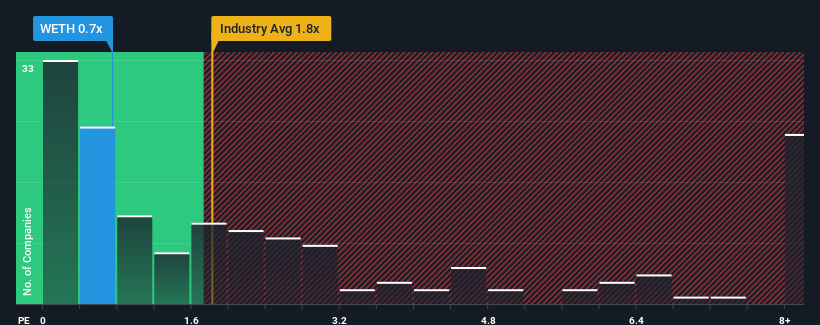
Since its price has dipped substantially, Wetouch Technology may be sending bullish signals at the moment with its price-to-sales (or "P/S") ratio of 0.7x, since almost half of all companies in the Electronic industry in the United States have P/S ratios greater than 1.8x and even P/S higher than 4x are not unusual. Nonetheless, we'd need to dig a little deeper to determine if there is a rational basis for the reduced P/S.
See our latest analysis for Wetouch Technology
What Does Wetouch Technology's Recent Performance Look Like?
It looks like revenue growth has deserted Wetouch Technology recently, which is not something to boast about. Perhaps the market believes the recent lacklustre revenue performance is a sign of future underperformance relative to industry peers, hurting the P/S. Those who are bullish on Wetouch Technology will be hoping that this isn't the case, so that they can pick up the stock at a lower valuation.
We don't have analyst forecasts, but you can see how recent trends are setting up the company for the future by checking out our free report on Wetouch Technology's earnings, revenue and cash flow.How Is Wetouch Technology's Revenue Growth Trending?
The only time you'd be truly comfortable seeing a P/S as low as Wetouch Technology's is when the company's growth is on track to lag the industry.
Taking a look back first, we see that there was hardly any revenue growth to speak of for the company over the past year. Although pleasingly revenue has lifted 33% in aggregate from three years ago, notwithstanding the last 12 months. Therefore, it's fair to say the revenue growth recently has been great for the company, but investors will want to ask why it has slowed to such an extent.
Comparing that to the industry, which is only predicted to deliver 7.0% growth in the next 12 months, the company's momentum is stronger based on recent medium-term annualised revenue results.
With this in mind, we find it intriguing that Wetouch Technology's P/S isn't as high compared to that of its industry peers. Apparently some shareholders believe the recent performance has exceeded its limits and have been accepting significantly lower selling prices.
What Does Wetouch Technology's P/S Mean For Investors?
Wetouch Technology's P/S has taken a dip along with its share price. Generally, our preference is to limit the use of the price-to-sales ratio to establishing what the market thinks about the overall health of a company.
Our examination of Wetouch Technology revealed its three-year revenue trends aren't boosting its P/S anywhere near as much as we would have predicted, given they look better than current industry expectations. When we see robust revenue growth that outpaces the industry, we presume that there are notable underlying risks to the company's future performance, which is exerting downward pressure on the P/S ratio. At least price risks look to be very low if recent medium-term revenue trends continue, but investors seem to think future revenue could see a lot of volatility.
There are also other vital risk factors to consider and we've discovered 4 warning signs for Wetouch Technology (3 are a bit unpleasant!) that you should be aware of before investing here.
Of course, profitable companies with a history of great earnings growth are generally safer bets. So you may wish to see this free collection of other companies that have reasonable P/E ratios and have grown earnings strongly.
Mobile Infrastructure for Defense and Disaster
The next wave in robotics isn't humanoid. Its fully autonomous towers delivering 5G, ISR, and radar in under 30 minutes, anywhere.
Get the investor briefing before the next round of contracts
Sponsored On Behalf of CiTechValuation is complex, but we're here to simplify it.
Discover if Wetouch Technology might be undervalued or overvalued with our detailed analysis, featuring fair value estimates, potential risks, dividends, insider trades, and its financial condition.
Access Free AnalysisHave feedback on this article? Concerned about the content? Get in touch with us directly. Alternatively, email editorial-team (at) simplywallst.com.
This article by Simply Wall St is general in nature. We provide commentary based on historical data and analyst forecasts only using an unbiased methodology and our articles are not intended to be financial advice. It does not constitute a recommendation to buy or sell any stock, and does not take account of your objectives, or your financial situation. We aim to bring you long-term focused analysis driven by fundamental data. Note that our analysis may not factor in the latest price-sensitive company announcements or qualitative material. Simply Wall St has no position in any stocks mentioned.
About NasdaqCM:WETH
Wetouch Technology
Engages in the research, development, manufacture, sale, and servicing of medium to large-sized projected capacitive touchscreens in the Peoples Republic of China, Taiwan, South Korea, and internationally.
Flawless balance sheet and good value.
Similar Companies
Market Insights

Weekly Picks

Early mover in a fast growing industry. Likely to experience share price volatility as they scale


A case for CA$31.80 (undiluted), aka 8,616% upside from CA$0.37 (an 86 bagger!).


Moderation and Stabilisation: HOLD: Fair Price based on a 4-year Cycle is $12.08
Recently Updated Narratives

Airbnb Stock: Platform Growth in a World of Saturation and Scrutiny

Adobe Stock: AI-Fueled ARR Growth Pushes Guidance Higher, But Cost Pressures Loom

Thomson Reuters Stock: When Legal Intelligence Becomes Mission-Critical Infrastructure
Popular Narratives


Crazy Undervalued 42 Baggers Silver Play (Active & Running Mine)


NVDA: Expanding AI Demand Will Drive Major Data Center Investments Through 2026

The AI Infrastructure Giant Grows Into Its Valuation
Trending Discussion


