
Legendary fund manager Li Lu (who Charlie Munger backed) once said, 'The biggest investment risk is not the volatility of prices, but whether you will suffer a permanent loss of capital.' So it seems the smart money knows that debt - which is usually involved in bankruptcies - is a very important factor, when you assess how risky a company is. We note that Viasat, Inc. (NASDAQ:VSAT) does have debt on its balance sheet. But the real question is whether this debt is making the company risky.
Why Does Debt Bring Risk?
Debt and other liabilities become risky for a business when it cannot easily fulfill those obligations, either with free cash flow or by raising capital at an attractive price. Ultimately, if the company can't fulfill its legal obligations to repay debt, shareholders could walk away with nothing. However, a more common (but still painful) scenario is that it has to raise new equity capital at a low price, thus permanently diluting shareholders. Having said that, the most common situation is where a company manages its debt reasonably well - and to its own advantage. The first step when considering a company's debt levels is to consider its cash and debt together.
View our latest analysis for Viasat
How Much Debt Does Viasat Carry?
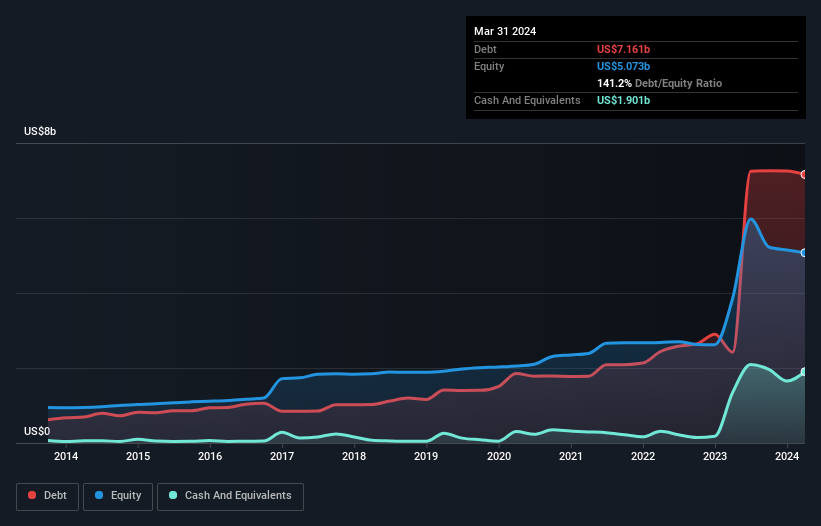
As you can see below, at the end of March 2024, Viasat had US$7.16b of debt, up from US$2.42b a year ago. Click the image for more detail. On the flip side, it has US$1.90b in cash leading to net debt of about US$5.26b.
How Strong Is Viasat's Balance Sheet?
The latest balance sheet data shows that Viasat had liabilities of US$1.30b due within a year, and liabilities of US$9.96b falling due after that. On the other hand, it had cash of US$1.90b and US$939.7m worth of receivables due within a year. So its liabilities outweigh the sum of its cash and (near-term) receivables by US$8.42b.
This deficit casts a shadow over the US$2.24b company, like a colossus towering over mere mortals. So we'd watch its balance sheet closely, without a doubt. At the end of the day, Viasat would probably need a major re-capitalization if its creditors were to demand repayment. The balance sheet is clearly the area to focus on when you are analysing debt. But ultimately the future profitability of the business will decide if Viasat can strengthen its balance sheet over time. So if you're focused on the future you can check out this free report showing analyst profit forecasts.
Over 12 months, Viasat reported revenue of US$4.3b, which is a gain of 68%, although it did not report any earnings before interest and tax. Shareholders probably have their fingers crossed that it can grow its way to profits.
Caveat Emptor
Despite the top line growth, Viasat still had an earnings before interest and tax (EBIT) loss over the last year. Indeed, it lost a very considerable US$741m at the EBIT level. Combining this information with the significant liabilities we already touched on makes us very hesitant about this stock, to say the least. That said, it is possible that the company will turn its fortunes around. But we think that is unlikely, given it is low on liquid assets, and burned through US$851m in the last year. So we think this stock is risky, like walking through a dirty dog park with a mask on. When analysing debt levels, the balance sheet is the obvious place to start. However, not all investment risk resides within the balance sheet - far from it. Be aware that Viasat is showing 3 warning signs in our investment analysis , you should know about...
If, after all that, you're more interested in a fast growing company with a rock-solid balance sheet, then check out our list of net cash growth stocks without delay.
Mobile Infrastructure for Defense and Disaster
The next wave in robotics isn't humanoid. Its fully autonomous towers delivering 5G, ISR, and radar in under 30 minutes, anywhere.
Get the investor briefing before the next round of contracts
Sponsored On Behalf of CiTechNew: Manage All Your Stock Portfolios in One Place
We've created the ultimate portfolio companion for stock investors, and it's free.
• Connect an unlimited number of Portfolios and see your total in one currency
• Be alerted to new Warning Signs or Risks via email or mobile
• Track the Fair Value of your stocks
Have feedback on this article? Concerned about the content? Get in touch with us directly. Alternatively, email editorial-team (at) simplywallst.com.
This article by Simply Wall St is general in nature. We provide commentary based on historical data and analyst forecasts only using an unbiased methodology and our articles are not intended to be financial advice. It does not constitute a recommendation to buy or sell any stock, and does not take account of your objectives, or your financial situation. We aim to bring you long-term focused analysis driven by fundamental data. Note that our analysis may not factor in the latest price-sensitive company announcements or qualitative material. Simply Wall St has no position in any stocks mentioned.
About NasdaqGS:VSAT
Viasat
Provides broadband and communications products and services in the United States and internationally.
Undervalued with mediocre balance sheet.
Similar Companies
Market Insights

Weekly Picks

Early mover in a fast growing industry. Likely to experience share price volatility as they scale


A case for CA$31.80 (undiluted), aka 8,616% upside from CA$0.37 (an 86 bagger!).


Moderation and Stabilisation: HOLD: Fair Price based on a 4-year Cycle is $12.08
Recently Updated Narratives

Meta’s Bold Bet on AI Pays Off

ADP Stock: Solid Fundamentals, But AI Investments Test Its Margin Resilience

Visa Stock: The Toll Booth at the Center of Global Commerce
Popular Narratives


Crazy Undervalued 42 Baggers Silver Play (Active & Running Mine)


NVDA: Expanding AI Demand Will Drive Major Data Center Investments Through 2026

The AI Infrastructure Giant Grows Into Its Valuation
Trending Discussion


