Advertisement
- United States
- /
- Tech Hardware
- /
- NasdaqGS:NTAP
Is NetApp’s Cloud Push the Key to Unlocking Value in 2025?

Reviewed by Bailey Pemberton
- Wondering whether NetApp is worth a closer look right now? If you have even the slightest curiosity about value, this stock’s story might surprise you.
- NetApp’s shares have been a bit of a rollercoaster this year, with a 0.7% gain over the last week, down 4.7% over the past month, and a -3.1% return year-to-date. Yet, those numbers hide a strong 109.2% surge over five years.
- Recent headlines highlight NetApp’s push into cloud-based solutions and a series of high-profile partnerships. Both of these developments have caught investor attention and driven conversation around the company’s growth potential, making short-term price moves more dynamic than usual.
- On valuation, NetApp actually scores a solid 5 out of 6 based on the most common checks for undervaluation. We will break down exactly how that stacks up against traditional and alternative valuation methods and reveal a fresh perspective for understanding value at the end of this article.
Find out why NetApp's -8.1% return over the last year is lagging behind its peers.
Approach 1: NetApp Discounted Cash Flow (DCF) Analysis
The Discounted Cash Flow (DCF) model estimates what a company is worth today by projecting its future cash flows and discounting them back to present value. This valuation method focuses on NetApp's ability to generate cash for shareholders, providing a forward-looking view that goes beyond short-term earnings.
For NetApp, the most recent Free Cash Flow reported is $1.68 billion. According to analyst estimates, Free Cash Flow is expected to rise to approximately $1.94 billion by 2028. While analysts provide forecasts for up to five years, further projections reaching $2.65 billion by 2035 are extrapolated from these trends. All cash flows are considered in US dollars.
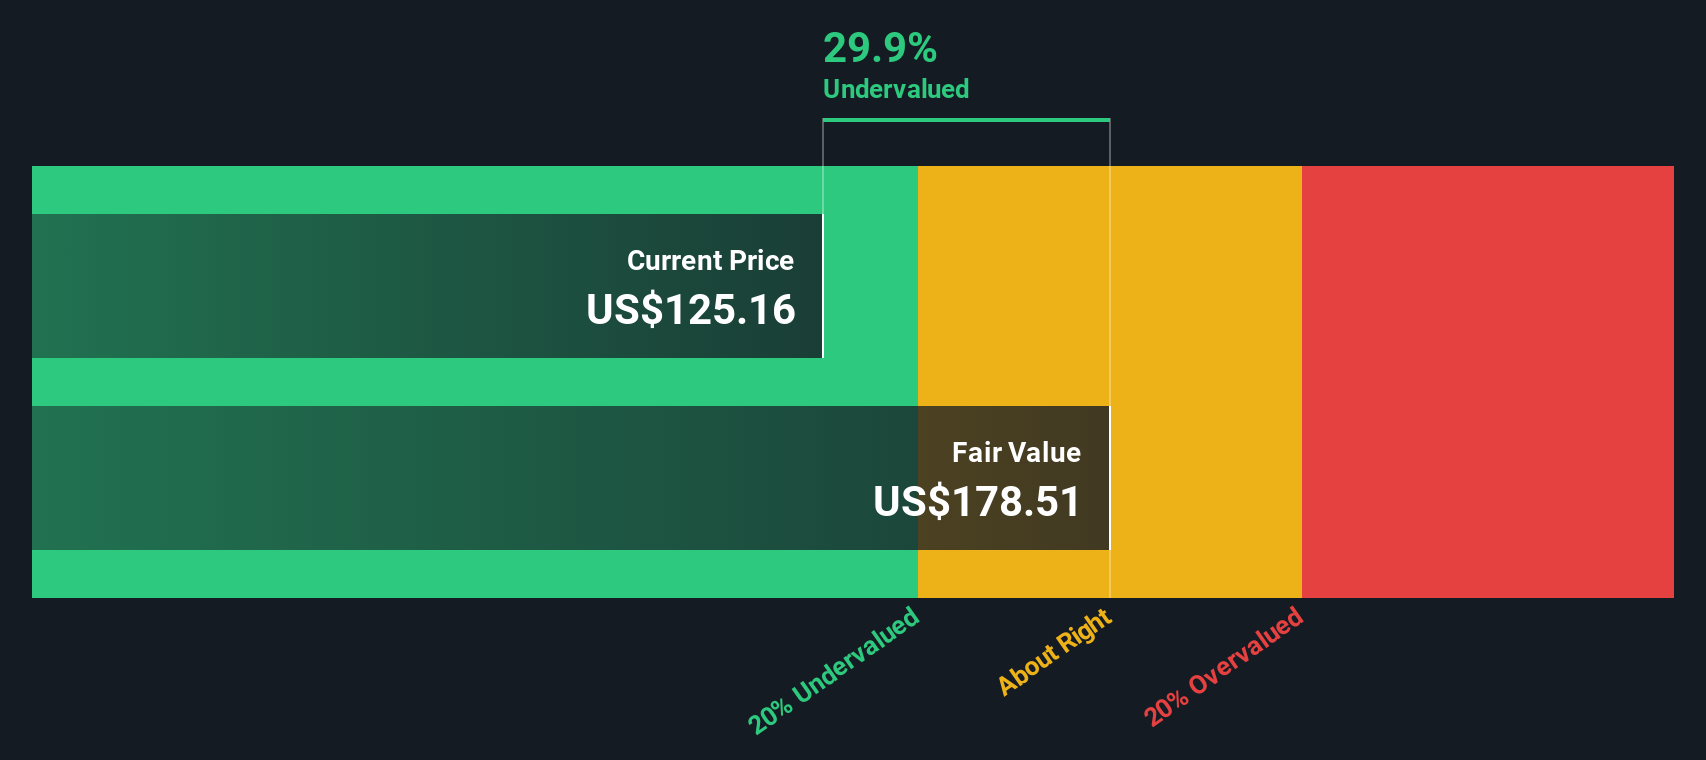
Using a DCF analysis with a two-stage Free Cash Flow to Equity model, NetApp’s estimated intrinsic value comes out to $184.94 per share. Compared to its current share price, this implies a 39.3% discount, suggesting that NetApp might be significantly undervalued based on future cash flow expectations.
Result: UNDERVALUED
Our Discounted Cash Flow (DCF) analysis suggests NetApp is undervalued by 39.3%. Track this in your watchlist or portfolio, or discover 927 more undervalued stocks based on cash flows.
Approach 2: NetApp Price vs Earnings
The Price-to-Earnings (PE) ratio is a widely used valuation metric for profitable companies like NetApp. It expresses how much investors are willing to pay for one dollar of earnings and is particularly useful when a business has a steady profit track record.
Whether a company’s PE ratio is considered high or low depends on growth expectations and perceived risks. Companies with stronger future growth or lower risk typically command higher PE ratios, while those facing challenges or uncertainty tend to trade at lower multiples.
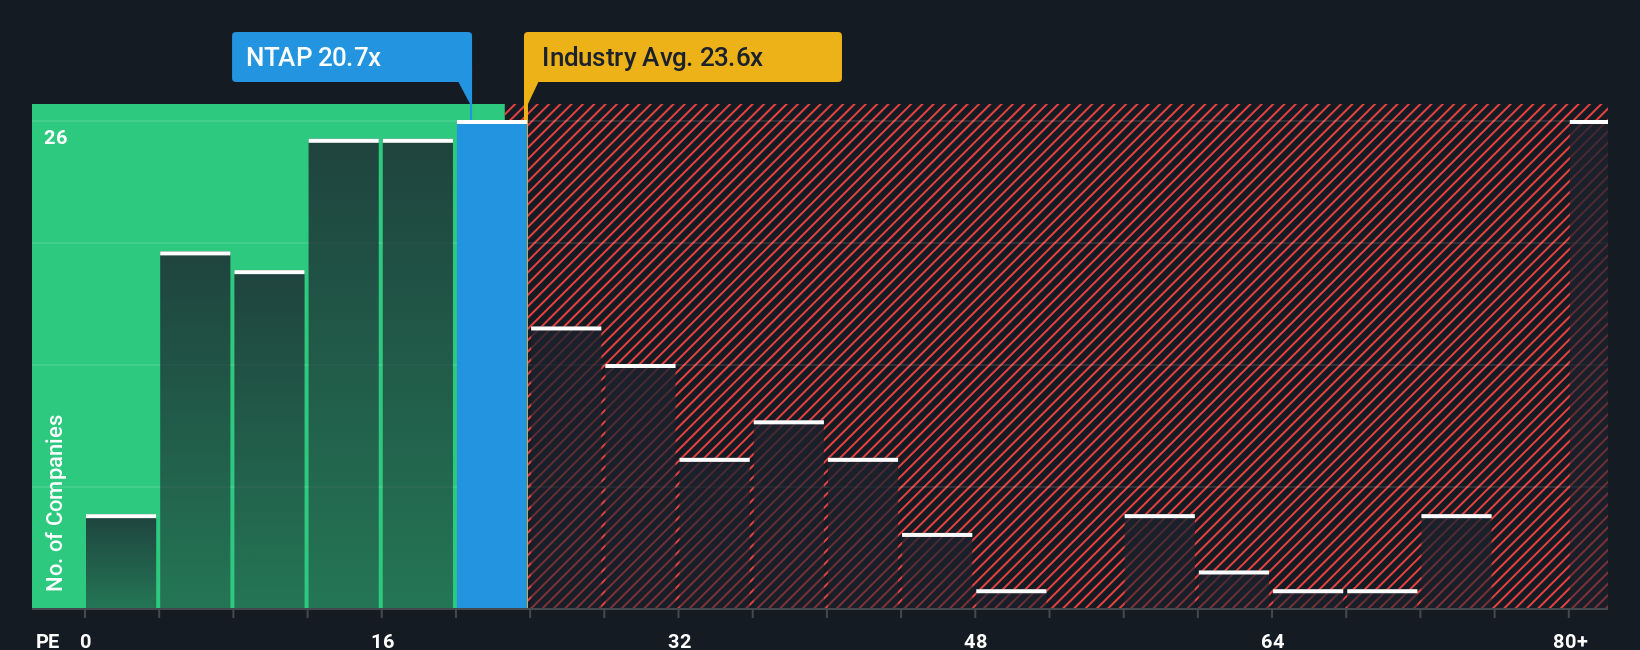
Currently, NetApp trades at a PE ratio of 18.9x. By comparison, the tech industry averages 22.5x, and NetApp’s closest peers have an average of 23.5x. This suggests NetApp is trading below the level of its sector and competitors; however, those numbers by themselves do not tell the full story.
Simply Wall St’s Fair Ratio offers a more nuanced benchmark. Unlike traditional industry or peer comparisons, the Fair Ratio reflects not just broad sector trends but also NetApp’s specific earnings growth, risk profile, profit margins, and market cap. For NetApp, the Fair Ratio is calculated as 25.2x. This is the multiple the company would likely trade at if the market perfectly balanced all relevant factors.
Compared to the Fair Ratio, NetApp’s current PE ratio is meaningfully lower. This indicates that when accounting for expected earnings growth, profitability, and risk, NetApp appears undervalued on a PE basis.
Result: UNDERVALUED
PE ratios tell one story, but what if the real opportunity lies elsewhere? Discover 1442 companies where insiders are betting big on explosive growth.
Upgrade Your Decision Making: Choose your NetApp Narrative
Earlier we mentioned there is an even better way to understand valuation, so let's introduce you to Narratives. A Narrative is an investor’s story behind the numbers, where you lay out your view of a company’s future by making your own assumptions about fair value, revenue growth, earnings, and margins.
Narratives link a company’s unique story, including its drivers, risks, and outlook, directly to a forecast and fair value. This approach transforms isolated financial estimates into actionable investment insights. On Simply Wall St’s Community page, Narratives are easy to use and are adopted every day by millions of investors seeking to bring their own perspective and research to life.
With Narratives, you can see at a glance if your analysis suggests NetApp aligns with your expectations by instantly comparing your Fair Value with the current price. As new news or earnings are released, Narratives automatically update, helping you stay on top of changing conditions without endless recalculations.
For example, one NetApp Narrative might forecast a fair value of $130 based on strong AI demand and high-margin growth, while another takes a more cautious $100 target due to margin pressures and intensifying competition. This demonstrates how investors can use the same numbers to arrive at completely different, yet reasoned, conclusions.
Do you think there's more to the story for NetApp? Head over to our Community to see what others are saying!
This article by Simply Wall St is general in nature. We provide commentary based on historical data and analyst forecasts only using an unbiased methodology and our articles are not intended to be financial advice. It does not constitute a recommendation to buy or sell any stock, and does not take account of your objectives, or your financial situation. We aim to bring you long-term focused analysis driven by fundamental data. Note that our analysis may not factor in the latest price-sensitive company announcements or qualitative material. Simply Wall St has no position in any stocks mentioned.
Valuation is complex, but we're here to simplify it.
Discover if NetApp might be undervalued or overvalued with our detailed analysis, featuring fair value estimates, potential risks, dividends, insider trades, and its financial condition.
Access Free AnalysisHave feedback on this article? Concerned about the content? Get in touch with us directly. Alternatively, email editorial-team@simplywallst.com
About NasdaqGS:NTAP
NetApp
Provides a range of enterprise software, systems, and services that customers use to transform their data infrastructures in the United States, Canada, Latin America, Europe, the Middle East, Africa, and the Asia Pacific.
Undervalued with excellent balance sheet and pays a dividend.
Similar Companies
Market Insights


Advertisement
Weekly Picks
ST


stuart_roberts on Upside Gold ·
An Undervalued 3.3Moz Gold Project in Canada
Fair Value:CA$5.0776.3% undervalued
141 followersusers have followed this narrative
1 commentusers have commented on this narrative
22 likesusers have liked this narrative
YA

Yang_ on SoFi Technologies ·
SoFi Technologies: The Apex Aggregator and the Infrastructure of the Modern Financial System
Fair Value:US$22.9823.3% undervalued
44 followersusers have followed this narrative
0 commentsusers have commented on this narrative
33 likesusers have liked this narrative
KO

Kouj on CSL ·
CSL: The Dip Is the Opportunity
Fair Value:AU$1559.3% undervalued
19 followersusers have followed this narrative
0 commentsusers have commented on this narrative
15 likesusers have liked this narrative
GA

GavrielH on DHT Holdings ·
DHT Holdings, inc: Strait of Hormuz Risk Amidst US-Israel vs Iran Tensions Spikes VLCC Rates.
Fair Value:US$3651.4% undervalued
15 followersusers have followed this narrative
0 commentsusers have commented on this narrative
9 likesusers have liked this narrative
Recently Updated Narratives
VE

Vestra on Nebius Group ·
Nebius Group NV (NBIS): The AI Infrastructure Pivot and the Meta Super-Contract
Fair Value:US$132.62.1% undervalued
1 followerusers have followed this narrative
0 commentsusers have commented on this narrative
0 likesusers have liked this narrative
VE

Vestra on Intel ·
Intel Corp (INTC): The 18A Node Pivot and the "Foundry First" Transformation
Fair Value:US$3338.7% overvalued
1 followerusers have followed this narrative
0 commentsusers have commented on this narrative
0 likesusers have liked this narrative
BI

Bigd on Volatus Aerospace ·
Strong buy
Fair Value:CA$1.0516.2% undervalued
7 followersusers have followed this narrative
1 commentusers have commented on this narrative
0 likesusers have liked this narrative
Popular Narratives
KA

kabz2342 on Nu Holdings ·
Nu holdings will continue to disrupt the South American banking market
Fair Value:US$64.377.8% undervalued
53 followersusers have followed this narrative
3 commentsusers have commented on this narrative
29 likesusers have liked this narrative
YA
Yang_ on SoFi Technologies ·
SoFi Technologies: The Apex Aggregator and the Infrastructure of the Modern Financial System
Fair Value:US$22.9823.3% undervalued
44 followersusers have followed this narrative
0 commentsusers have commented on this narrative
33 likesusers have liked this narrative
AN


AnalystConsensusTarget on Microsoft ·
Analyst Commentary Highlights Microsoft AI Momentum and Upward Valuation Amid Growth and Competitive Risks
Fair Value:US$59632.9% undervalued
1312 followersusers have followed this narrative
2 commentsusers have commented on this narrative
10 likesusers have liked this narrative
Trending Discussion


DA

daqui_luis on Corticeira Amorim S.G.P.S ·
Great analysis on a great and solid company with a dominant position in the Cork Market.
1
|0