Advertisement
- United States
- /
- Tech Hardware
- /
- NasdaqGS:NTAP
Is It Time To Reconsider NetApp (NTAP) After Recent Share Price Weakness?

Reviewed by Bailey Pemberton
- If you are wondering whether NetApp's current share price still reflects good value, this article will walk through what the numbers are really saying about the stock.
- NetApp closed at US$98.22 recently, with returns of a 1.4% decline over 7 days, an 8.4% decline over 30 days, a 7.7% decline year to date, a 14.8% decline over 1 year, 54.2% over 3 years and 62.4% over 5 years.
- Recent coverage of NetApp has focused on its role in data storage and cloud solutions and how investor expectations around that positioning feed into the share price. This backdrop helps explain why the stock has seen mixed shorter term returns while longer term returns have been stronger.
- On Simply Wall St's valuation checks, NetApp scores a 6/6 valuation score. We will unpack this using several common valuation approaches before finishing with a different way of thinking about value that could be even more useful for long term investors.
Find out why NetApp's -14.8% return over the last year is lagging behind its peers.
Approach 1: NetApp Discounted Cash Flow (DCF) Analysis
A Discounted Cash Flow model takes estimates of the cash a company may generate in the future, then discounts those cash flows back to today to arrive at an estimate of what the business could be worth right now.
For NetApp, the model used is a 2 Stage Free Cash Flow to Equity approach. The latest twelve month Free Cash Flow is about $1.68b. Analysts have supplied several years of Free Cash Flow estimates, and Simply Wall St extends these further, with projected Free Cash Flow of around $2.34b in 2035 based on the ten year schedule provided.
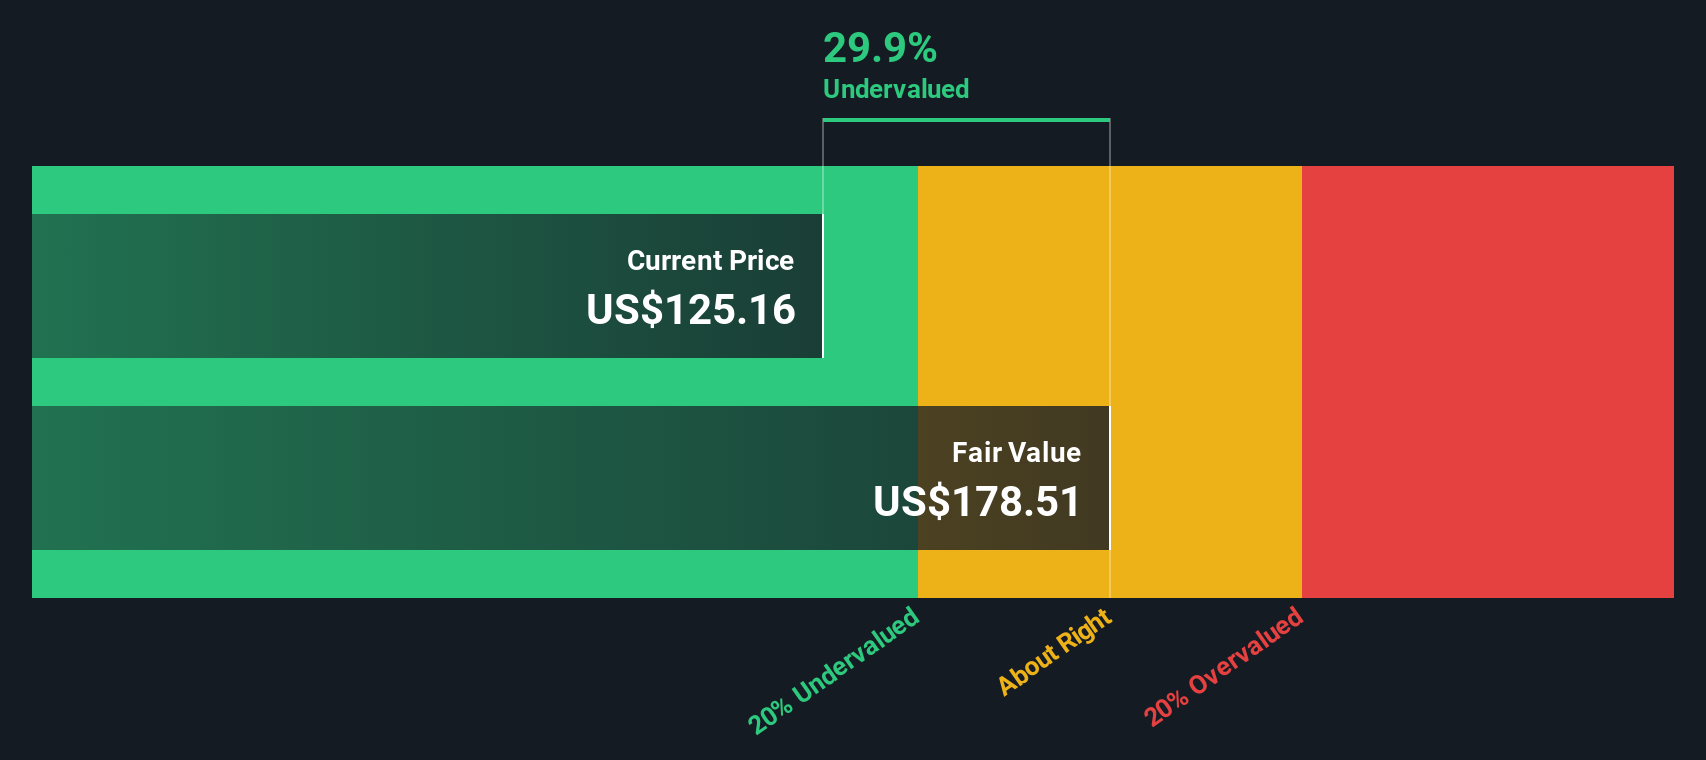
After discounting each of those projected cash flows back to today, the DCF model arrives at an estimated intrinsic value of about $167.64 per share. Compared with the recent share price of $98.22, this implies an intrinsic discount of 41.4%, which suggests the shares are currently priced below this cash flow based estimate of value.
Result: UNDERVALUED
Our Discounted Cash Flow (DCF) analysis suggests NetApp is undervalued by 41.4%. Track this in your watchlist or portfolio, or discover 55 more high quality undervalued stocks.
Approach 2: NetApp Price vs Earnings
For profitable companies, the P/E ratio is often the go to yardstick because it ties what you are paying directly to what the business is currently earning per share. It gives you a quick sense of how many dollars investors are willing to pay for each dollar of earnings.
What counts as a “normal” P/E depends heavily on how fast earnings are expected to grow and how risky those earnings are. Higher expected growth or lower perceived risk can justify a higher P/E, while slower growth or higher risk usually point to a lower multiple being more reasonable.
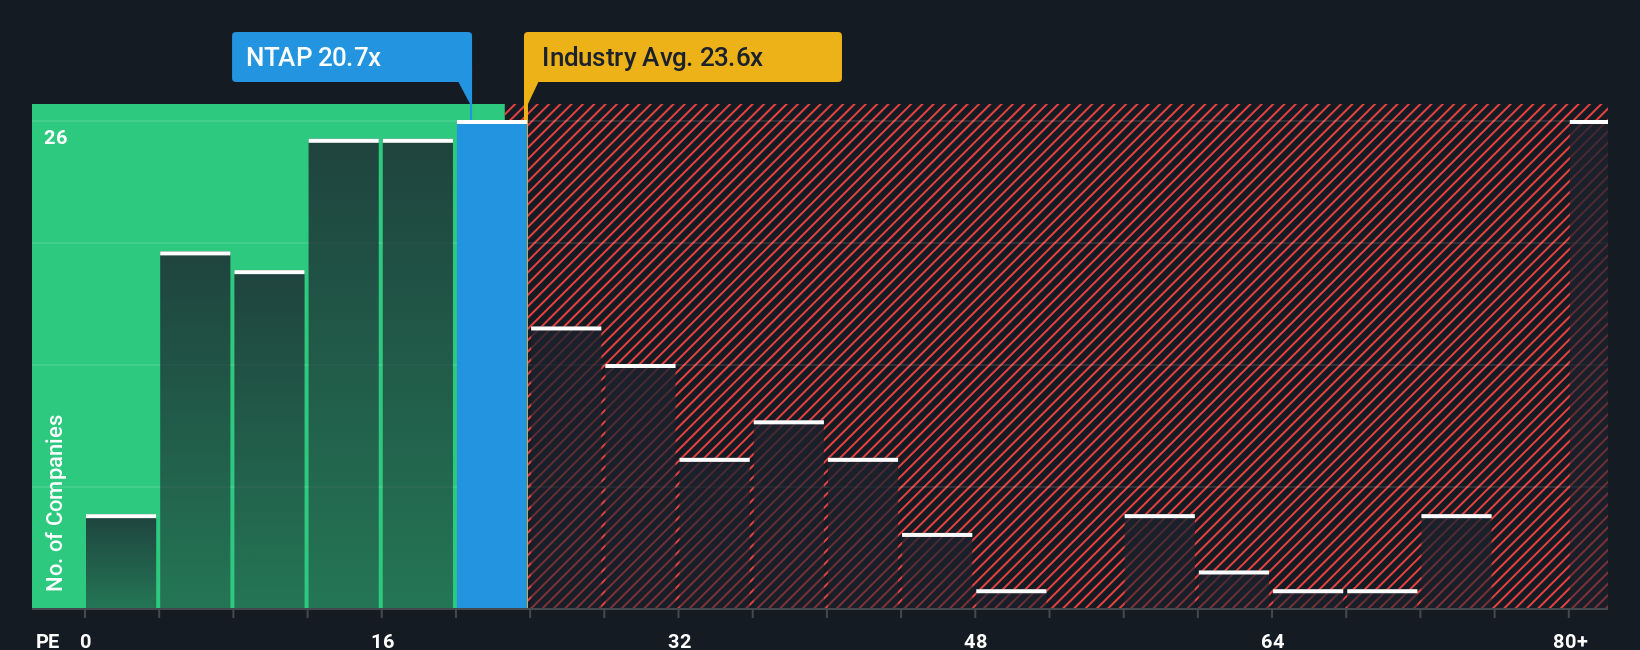
NetApp is trading on a P/E of 16.53x. That sits below the broader Tech industry average of 22.19x and well below the peer group average of 55.36x. Simply Wall St also calculates a proprietary “Fair Ratio” for NetApp of 25.96x, which represents the P/E that could be appropriate given its earnings profile, industry, profit margins, market value and specific risks.
This Fair Ratio can be more useful than simple peer or industry comparisons because it adjusts for differences in growth, risk, profitability and size rather than assuming all companies deserve similar multiples. Since NetApp’s current P/E of 16.53x is below the Fair Ratio of 25.96x, this points to the shares appearing undervalued on this earnings based view.
Result: UNDERVALUED
P/E ratios tell one story, but what if the real opportunity lies elsewhere? Start investing in legacies, not executives. Discover our 23 top founder-led companies.
Upgrade Your Decision Making: Choose your NetApp Narrative
Earlier we mentioned that there is an even better way to understand valuation. On Simply Wall St you can use Narratives on the Community page to attach your own NetApp story to the numbers by linking your view of its AI and hybrid cloud opportunity, risks around competition and geography, and assumptions for revenue, earnings and margins into a clear forecast and Fair Value. You can then compare that Fair Value with the current price to decide whether NetApp looks attractive or not. The platform automatically refreshes your Narrative when fresh news or earnings arrive and allows very different views to sit side by side. For example, one investor might think NetApp could reasonably be worth closer to the high analyst target of US$130 based on stronger margin and cloud traction, while another might anchor on the low target of US$100 because they focus more on storage market pressures and partnership risks.
Do you think there's more to the story for NetApp? Head over to our Community to see what others are saying!

This article by Simply Wall St is general in nature. We provide commentary based on historical data and analyst forecasts only using an unbiased methodology and our articles are not intended to be financial advice. It does not constitute a recommendation to buy or sell any stock, and does not take account of your objectives, or your financial situation. We aim to bring you long-term focused analysis driven by fundamental data. Note that our analysis may not factor in the latest price-sensitive company announcements or qualitative material. Simply Wall St has no position in any stocks mentioned.
Valuation is complex, but we're here to simplify it.
Discover if NetApp might be undervalued or overvalued with our detailed analysis, featuring fair value estimates, potential risks, dividends, insider trades, and its financial condition.
Access Free AnalysisHave feedback on this article? Concerned about the content? Get in touch with us directly. Alternatively, email editorial-team@simplywallst.com
About NasdaqGS:NTAP
NetApp
Provides a range of enterprise software, systems, and services that customers use to transform their data infrastructures in the United States, Canada, Latin America, Europe, the Middle East, Africa, and the Asia Pacific.
Flawless balance sheet with proven track record and pays a dividend.
Similar Companies
Market Insights



Advertisement
Weekly Picks
CE


Ceazar on Sparc AI ·
When GPS fails: this small cap is fixing a $54B drone problem
Fair Value:US$3.8756.3% undervalued
12 followersusers have followed this narrative
0 commentsusers have commented on this narrative
3 likesusers have liked this narrative
BL


BlackGoat on IREN ·
IREN's Bold Moves in Sustainable Bitcoin Mining & AI Data Centers
Fair Value:US$71.4852.5% undervalued
210 followersusers have followed this narrative
6 commentsusers have commented on this narrative
32 likesusers have liked this narrative
HE


HedgeY on Arm Holdings ·
The Architecture Layer of AI Computing - But Priced Like the Future Already Arrived?
Fair Value:US$43043.1% undervalued
13 followersusers have followed this narrative
1 commentusers have commented on this narrative
3 likesusers have liked this narrative
HI


Hidden_Rock_Capital on Fiserv ·
Temporary "perfect storm" leads to opportunity to buy financial services leader for less than 5x long-term earnings
Fair Value:US$119.9954.8% undervalued
18 followersusers have followed this narrative
0 commentsusers have commented on this narrative
8 likesusers have liked this narrative
Recently Updated Narratives
ON

Ontological on Lotus Technology ·
Lotus Tech, Finloop and FOMO Pay Collaborate to Explore Vehicle Tokenization
Fair Value:US$2.462.9% undervalued
1 followerusers have followed this narrative
1 commentusers have commented on this narrative
0 likesusers have liked this narrative
NE

newsfinder11221 on Robo.ai ·
Robo.ai (NASDAQ: AIIO): Building the Infrastructure Behind the AI Revolution
Fair Value:US$539.0% undervalued
1 followerusers have followed this narrative
3 commentsusers have commented on this narrative
0 likesusers have liked this narrative
EU


European_Hidden_Gem_Stocks on MINT Société anonyme ·
Mint SA: A French Micro-Cap Energy Retailer Worth Watching
Fair Value:€1153.1% undervalued
1 followerusers have followed this narrative
0 commentsusers have commented on this narrative
0 likesusers have liked this narrative
Popular Narratives
CU

CubanEros on Microsoft ·
A wonderful business at reasonable price.
Fair Value:US$419.916.3% undervalued
90 followersusers have followed this narrative
0 commentsusers have commented on this narrative
6 likesusers have liked this narrative
OS


oscargarcia on NVIDIA ·
The company that went from selling GPUs to gamers to becoming the AI arms dealer of the 21st century.
Fair Value:US$28029.6% undervalued
202 followersusers have followed this narrative
9 commentsusers have commented on this narrative
15 likesusers have liked this narrative
BE

benjamin_lvieq on PayPal Holdings ·
PayPal: PayPal Doesn't Need to Grow – It Needs to Stop Falling – A Mispriced Cash Machine With a Cannibal Buyback
Fair Value:US$6510.3% undervalued
73 followersusers have followed this narrative
2 commentsusers have commented on this narrative
11 likesusers have liked this narrative
Trending Discussion
DE

derek_3wsdg on Teladoc Health ·
You’ve overlooked the activist investor factor. Travis Cocke’s Voss has announced 5% ownership through a 13G filing. They’ve added to that 5% since, and in doing so, have created a structural trap door for 27.42 Million Shares actively sold short. Chuck will announce lots of positives on July 29 but it’s what Voss announces shortly after that will rock the overextended Teledoc shorts. The Walmart partnership is the tip of the iceberg. The market is missing the sheer regulatory and enterprise friction of modern corporate healthcare. Teladoc isn't a "consumer app"; it is the primary digital infrastructure integrated directly into the legacy backends of Tier-1 insurance companies and fortune 500 employers, covering 105 million+ lives. Teladoc is acting as the digital top-of-funnel engine for the world's largest retailer. If Voss pushes the narrative that Teladoc is effectively the outsourced digital brain of Walmart's entire healthcare footprint, the fair value shifts from a basic health multiple to an enterprise distribution premium. Additionally , we are in a structural gold rush for high-quality, legally compliant, longitudinal medical data to train vertical healthcare AI models. Large technology hyperscalers and pharmaceutical giants cannot simply scrape the internet for this; they need structured clinical inputs. Teladoc sits on one of the largest de-identified virtual medical datasets on earth. From the activist playbook , we’ll see Voss demand the immediate creation of a Data & Diagnostics Licensing Division, transforming a legacy liability into an incredibly high-margin, pure-software data asset that requires zero human clinician hours to scale. Chuck is doing great work and deserves credi5 for the Teledoc turnaround but it will be Travis Cocke who will be responsible for a share price way beyond your $15 valuation.
1
|0
BL

Blegells on Terra Balcanica Resources ·
⏫42X THE AVERAGE DAILY TRADING VOLUME TODAY, JULY 28 🐂🐂🐂 FORTY-TWO!
0
|0