Advertisement
- United States
- /
- Tech Hardware
- /
- NasdaqGS:NTAP
Can NetApp’s Recent Partnership News Signal Opportunity Amid Share Price Dip?

Simply Wall St
Reviewed by Bailey Pemberton
If you are wondering what to do with NetApp stock right now, you are not alone. Investors have their eyes glued to the numbers as NetApp’s share price has seen some ups and downs recently, dropping about 2% over the past week and a little more over the past month. Despite these short-term shifts, the big picture is hard to ignore. Over the last three years, NetApp’s stock has soared nearly 80%, and the five-year return is approaching 200%.
These notable returns show that NetApp has delivered consistent long-term growth, which has helped fuel optimism among many shareholders. However, market sentiment has shifted recently, with investors keeping a close watch on industry trends like the ever-growing demand for cloud data management and broader volatility in the tech sector. News around NetApp’s expanding partnerships and product innovation suggest the company is investing for the future, even if the benefits are not all immediately reflected in the share price.
But let’s cut to the chase: based on a valuation score of 5 out of 6, NetApp currently checks nearly all the boxes for being undervalued. That makes it an especially interesting case for anyone considering buying or holding the stock right now. Next, we will break down the factors that go into this score, looking at a range of traditional valuation methods. And if you are searching for a smarter, more complete way to decide if NetApp is truly undervalued, stay tuned for something even better later in the article.
Why NetApp is lagging behind its peers
Approach 1: NetApp Discounted Cash Flow (DCF) Analysis
The Discounted Cash Flow (DCF) method estimates what a company's business is worth today by projecting all future free cash flows and discounting them back to their present value. This approach helps investors determine whether a stock is trading at a price below or above its intrinsic value based on cash flow expectations rather than near-term market sentiment.
For NetApp, the latest trailing twelve months’ free cash flow stands at $1.65 billion. Analysts forecast steady growth, with annual free cash flow projections reaching $1.91 billion by April 2028. Beyond analyst estimates, further growth is extrapolated, suggesting free cash flow could surpass $2.49 billion by 2035. All figures are based in US dollars.
The application of this DCF model results in an estimated fair value per share of about $179. This is roughly 34.8% higher than NetApp's current share price. This implies the stock is significantly undervalued according to cash flow-tested fundamentals.
Result: UNDERVALUED
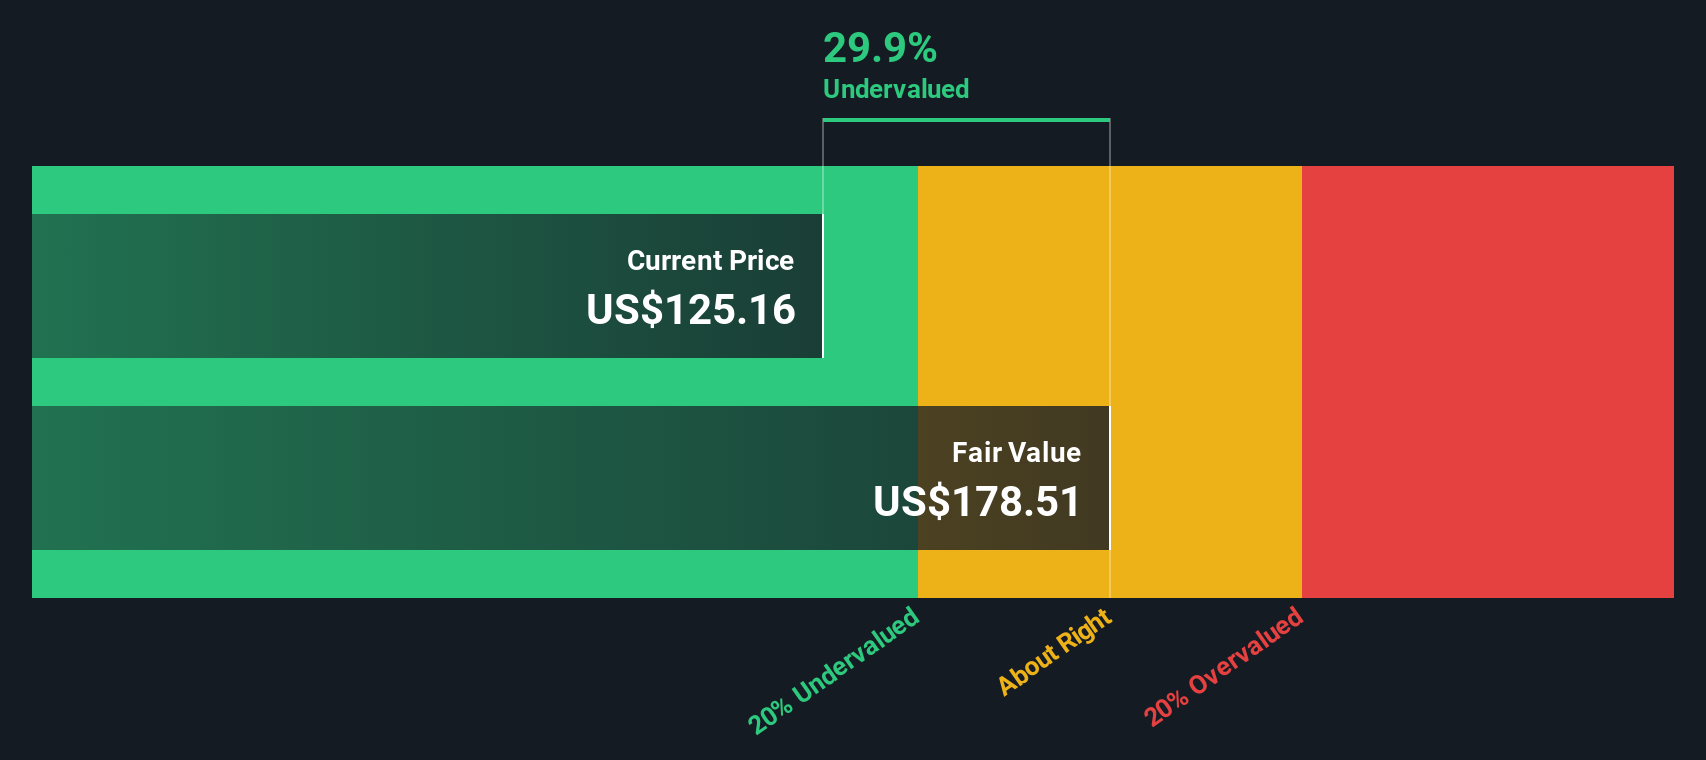
Our Discounted Cash Flow (DCF) analysis suggests NetApp is undervalued by 34.8%. Track this in your watchlist or portfolio, or discover more undervalued stocks.
Approach 2: NetApp Price vs Earnings
For profitable companies like NetApp, the price-to-earnings (PE) ratio is a reliable measure for comparing valuation. It provides investors with a quick way to assess how much they are paying for a company’s current earnings. Typically, a higher PE ratio can signal expectations for faster future growth or lower business risk. In contrast, a lower PE might reflect slower growth prospects or greater uncertainty.
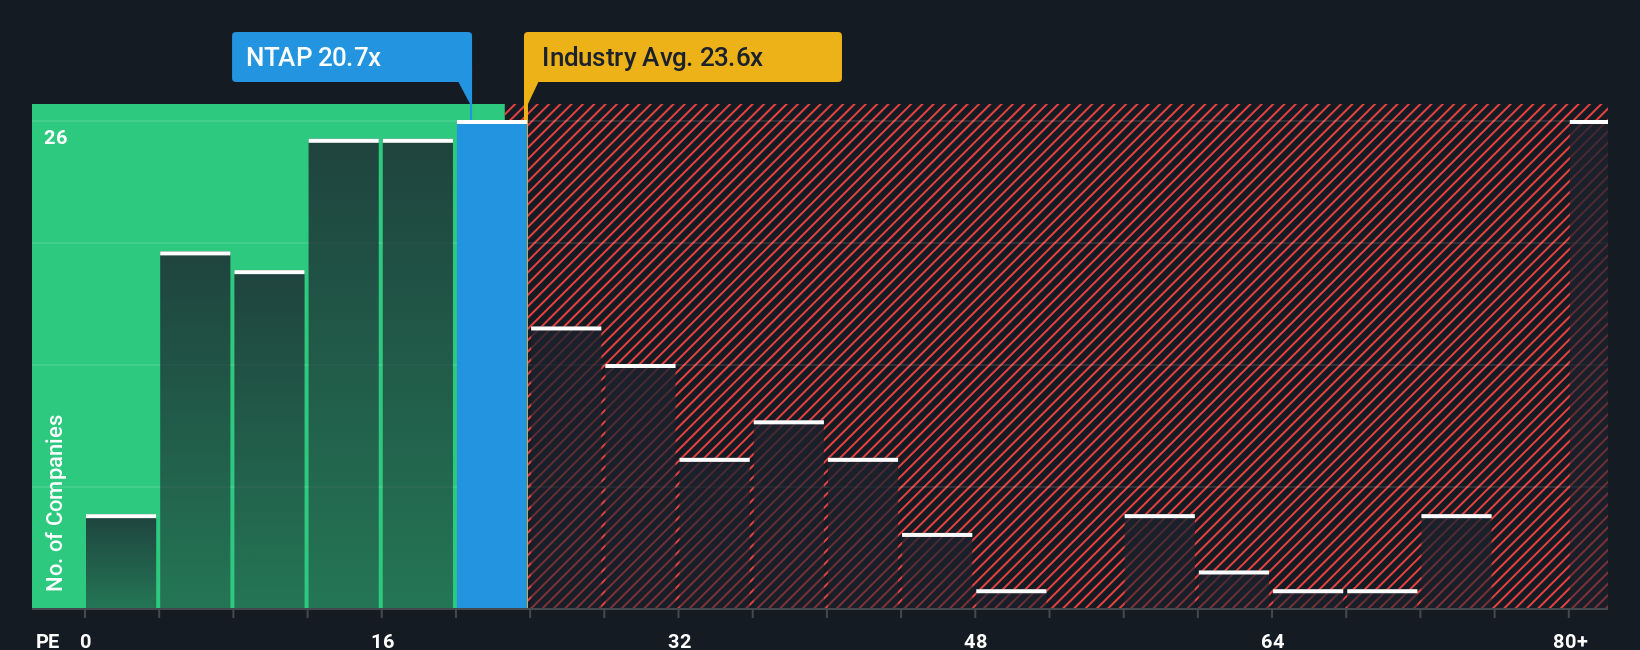
NetApp’s current PE ratio stands at 19.9x, which is noticeably below the tech industry’s average PE of 24.2x and the peer average of 24.7x. On the surface, this suggests the stock may be cheaper than its competitors when measured against earnings. However, comparing only to industry averages or peers can miss company-specific factors, such as NetApp’s growth outlook, profitability, profit margins, and company size.
This is where Simply Wall St’s proprietary Fair Ratio comes in. The Fair Ratio, calculated to be 27.8x for NetApp, sets a benchmark that factors in the company’s expected growth, risks, margins, industry profile, and market capitalization. This tailored metric goes beyond surface-level comparisons and gives a much clearer read on whether the current price reflects a fair deal. Since NetApp’s actual PE is well below this Fair Ratio, the stock comes across as undervalued based on earnings potential and company specifics.
Result: UNDERVALUED
PE ratios tell one story, but what if the real opportunity lies elsewhere? Discover companies where insiders are betting big on explosive growth.
Upgrade Your Decision Making: Choose your NetApp Narrative
Earlier we mentioned there is an even better way to understand valuation, so let’s introduce you to Narratives. Narratives are a simple, yet powerful, tool that let you define your own view of a company’s future by turning your personal assumptions about growth, margins, and fair value into a story that makes sense of the numbers. Instead of just relying on analyst targets or static models, Narratives connect what you believe is possible for NetApp to a forecast of earnings and revenues and then translate that into a fair value for the stock.
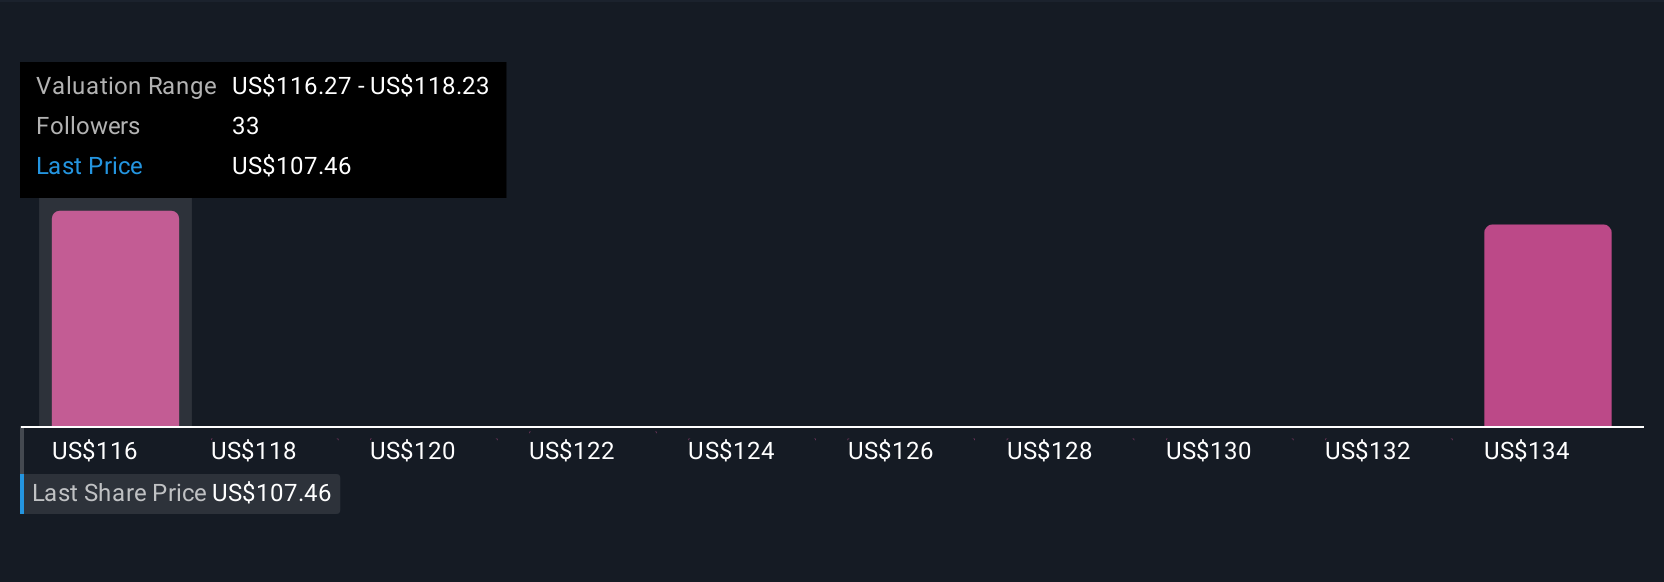
This approach gives investors direct control over their outlook while making the process accessible. On Simply Wall St’s Community page, millions of investors use Narratives to compare fair value estimates to the current market price and decide when to buy, hold, or sell. Narratives automatically update with new data, such as earnings and news, so your analysis stays relevant. For example, some investors might build a bullish Narrative, reflecting confidence in NetApp’s AI-driven growth and set a fair value toward the upper end of recent analyst targets, while others take a more cautious view, pricing in competition risks and aiming for the lower end. With Narratives, you get a smarter, more adaptable way to turn knowledge into actionable investment decisions.
Do you think there's more to the story for NetApp? Create your own Narrative to let the Community know!
This article by Simply Wall St is general in nature. We provide commentary based on historical data and analyst forecasts only using an unbiased methodology and our articles are not intended to be financial advice. It does not constitute a recommendation to buy or sell any stock, and does not take account of your objectives, or your financial situation. We aim to bring you long-term focused analysis driven by fundamental data. Note that our analysis may not factor in the latest price-sensitive company announcements or qualitative material. Simply Wall St has no position in any stocks mentioned.
Valuation is complex, but we're here to simplify it.
Discover if NetApp might be undervalued or overvalued with our detailed analysis, featuring fair value estimates, potential risks, dividends, insider trades, and its financial condition.
Access Free AnalysisHave feedback on this article? Concerned about the content? Get in touch with us directly. Alternatively, email editorial-team@simplywallst.com
About NasdaqGS:NTAP
NetApp
Provides a range of enterprise software, systems, and services that customers use to transform their data infrastructures in the United States, Canada, Latin America, Europe, the Middle East, Africa, and the Asia Pacific.
Undervalued with excellent balance sheet and pays a dividend.
Similar Companies
Market Insights

Advertisement
Community Narratives
Finding The True Value Of A Logistics Powerhouse
Fair Value US$95.21|8.4% undervalued
NV
Community Contributor
Paradigm Biopharmaceuticals Will Lead Osteoarthritis Treatment with Zilosul's FDA Success
Fair Value AU$5.50|92.1% undervalued
AM
Community Contributor
Barrick Mining (ABX:CA): A Gold Hedge against a U.S. Shutdown
Fair Value CA$60.00|24.2% undervalued
GM
Community Contributor