Advertisement
- United States
- /
- Electronic Equipment and Components
- /
- NasdaqGS:FLEX
Flex (FLEX) Earnings Growth Outpaces Market but Revenue Lags, Reinforcing Quality Narrative

Simply Wall St
Reviewed by Simply Wall St
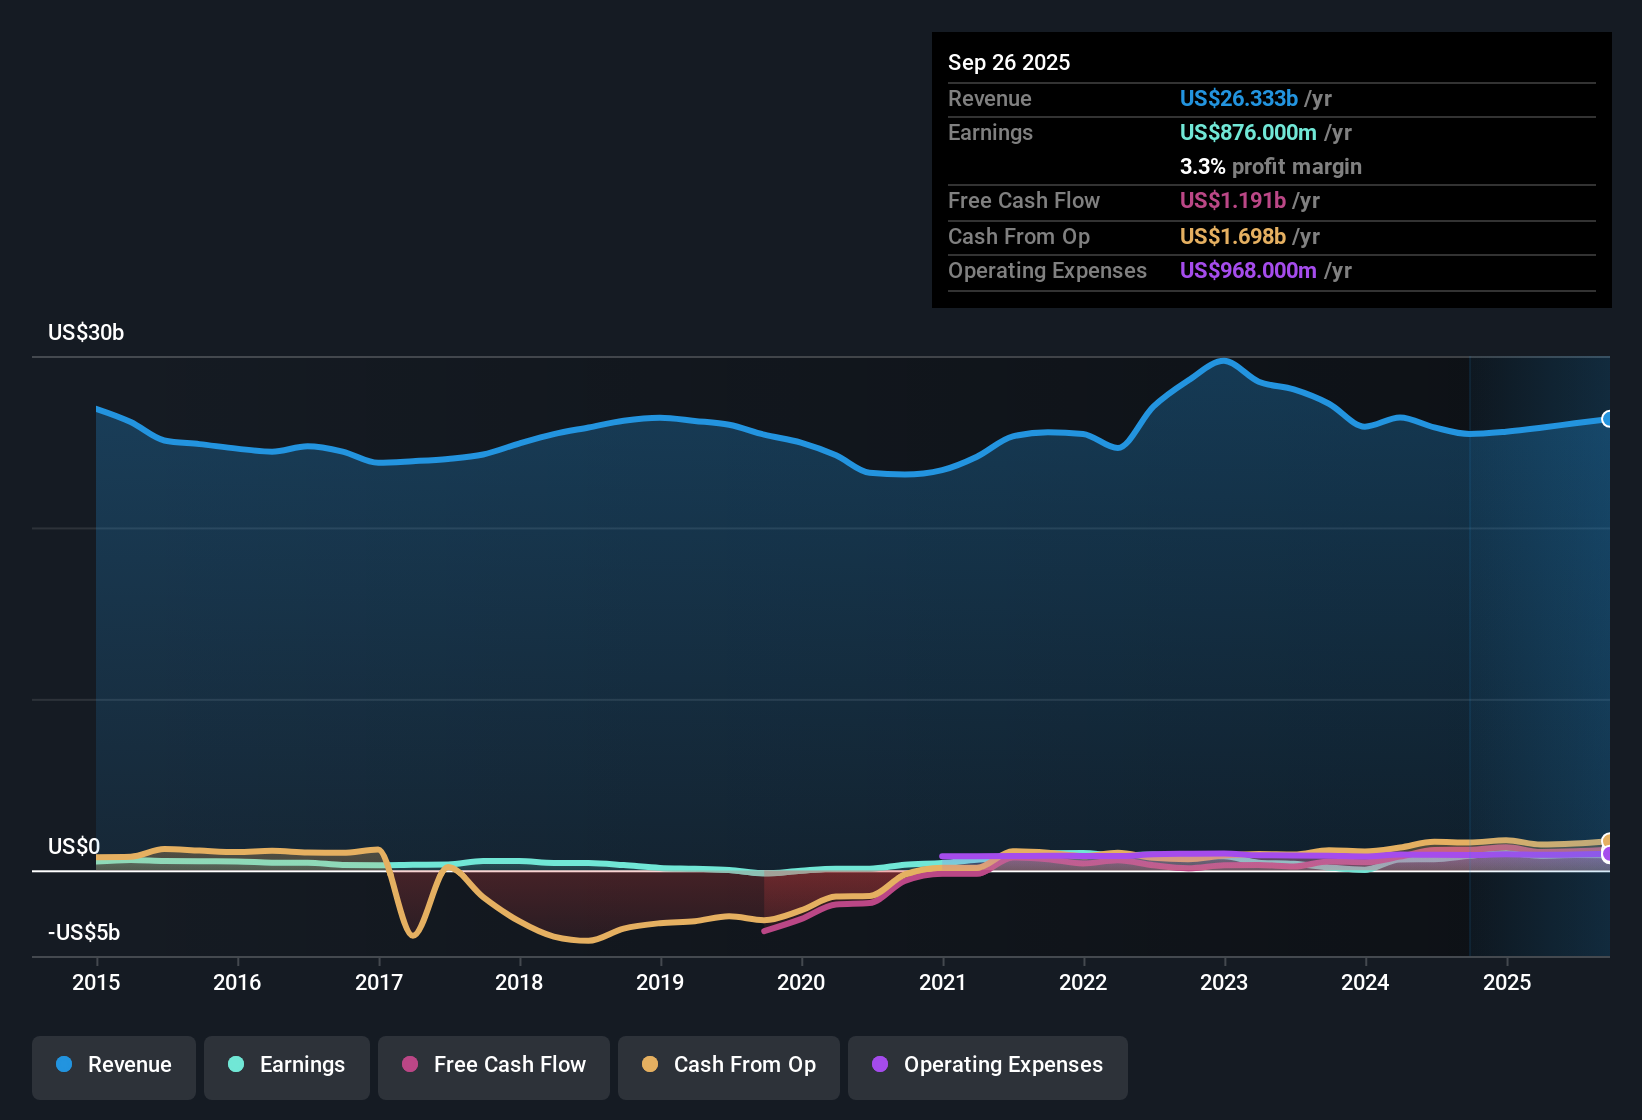
Flex (FLEX) delivered annual earnings growth of 19.4%, outpacing the US market’s 15.7% rate, while maintaining net profit margins at 3.3%, which is unchanged from a year ago. Revenue is projected to grow 5.8% annually, lagging behind broader market peers. However, the company’s five-year track record shows consistent profit growth of 4% per year. Together, these numbers highlight a mix of strong profitability, persistent margins, and a steady performance profile.
See our full analysis for Flex.Next up, we’ll see how these headline results compare to the recent narratives and perspectives shaping market sentiment for Flex.
See what the community is saying about Flex
Stable Margins Backed by Automation Gains
- Profit margins are holding steady at 3.3%, matching last year’s level, even as automation investments are unlocking further productivity gains across Flex’s manufacturing footprint.
- Analysts' consensus view highlights several competitive factors supporting ongoing margin stability:
- Accelerating automation and AI-enablement at Flex’s facilities are expected to cut costs and gradually lift operating margins over the next three years. Projections call for margins to rise from 3.4% to 4.6% by 2026.
- Regionalized production and advanced manufacturing are cited as key drivers for future margin resilience, setting Flex apart from rival contract manufacturers that face price competition.
- The consensus narrative points out that improved productivity and resilient margins are giving Flex earnings durability even within a cost-competitive sector.
- Bulls and skeptics may look for margin slippage if automation gains start to flatten. So far, however, the outlook remains constructive.
- Ongoing investment in process technology is seen as a tool to defend margins against pricing headwinds, aligning with the consensus narrative that margin expansion remains achievable.
See how Flex’s disciplined investments are driving efficiency gains and why that’s central to the balanced growth outlook. 📊 Read the full Flex Consensus Narrative.
Revenue Mix Shifting to High-Growth Segments
- Growth in high-margin segments is transforming the revenue base. Flex’s data center business alone is projected to expand by 35% annually, well above the group’s overall 3.7% three-year revenue CAGR.
- Analysts' consensus view underscores:
- Strategic investment in verticals such as healthcare, automotive electronics, and AI infrastructure is shifting the overall revenue mix, increasing both stability and long-term margin potential.
- The move toward IP-driven, integrated solutions deepens customer relationships and creates new opportunities for higher-value revenue streams beyond traditional contract manufacturing.
Valuation: Discount to Peers, Premium to Sector
- Flex trades at $63.99, sitting just below its DCF fair value of $64.45, and appears undervalued compared to peer average P/E multiples, while still being more expensive than the broader US electronic industry on the same metric.
- Analysts' consensus view frames this as a balanced setup:
- With the current share price just 2.9% below the analyst consensus target ($71.57), Flex looks fairly valued rather than obviously discounted or stretched.
- The muted gap between share price and consensus target suggests that, in analysts' eyes, new upside would need to be driven by better-than-expected growth or further positive margin surprises.
Next Steps
To see how these results tie into long-term growth, risks, and valuation, check out the full range of community narratives for Flex on Simply Wall St. Add the company to your watchlist or portfolio so you'll be alerted when the story evolves.
Spot something in the data that stands out? Share your unique angle and shape your own story in just a few minutes. Do it your way
A great starting point for your Flex research is our analysis highlighting 3 key rewards and 1 important warning sign that could impact your investment decision.
See What Else Is Out There
While Flex is showing resilience in margins and select high-growth segments, its overall revenue growth is trailing the broader market and lacks stronger expansion drivers.
If you want exposure to businesses with more consistent and robust top-line momentum, consider companies delivering steady results through cycles by starting your research with stable growth stocks screener (2110 results).
This article by Simply Wall St is general in nature. We provide commentary based on historical data and analyst forecasts only using an unbiased methodology and our articles are not intended to be financial advice. It does not constitute a recommendation to buy or sell any stock, and does not take account of your objectives, or your financial situation. We aim to bring you long-term focused analysis driven by fundamental data. Note that our analysis may not factor in the latest price-sensitive company announcements or qualitative material. Simply Wall St has no position in any stocks mentioned.
New: AI Stock Screener & Alerts
Our new AI Stock Screener scans the market every day to uncover opportunities.
• Dividend Powerhouses (3%+ Yield)
• Undervalued Small Caps with Insider Buying
• High growth Tech and AI Companies
Or build your own from over 50 metrics.
Have feedback on this article? Concerned about the content? Get in touch with us directly. Alternatively, email editorial-team@simplywallst.com
About NasdaqGS:FLEX
Flex
Provides technology innovation, supply chain, and manufacturing solutions to data center, communications, enterprise, consumer, automotive, industrial, healthcare, industrial, and power industries.
Flawless balance sheet with solid track record.
Similar Companies
Market Insights

Advertisement
Community Narratives
The company that turned a verb into a global necessity and basically runs the modern internet, digital ads, smartphones, maps, and AI.
Fair Value US$300.00|6.2% undervalued
OS
Community Contributor
Flowers Foods Pays A Fair Price For Health
Fair Value US$16.12|25.1% undervalued
NV
Community Contributor
TMX Group will thrive with 33.3% profit margin and enduring market moat
Fair Value CA$49.90|0.04% overvalued
LI
Community Contributor