
Advertisement
- United States
- /
- Tech Hardware
- /
- NasdaqGS:AVID
Is Avid Technology, Inc. (NASDAQ:AVID) Trading At A 22% Discount?
Today we'll do a simple run through of a valuation method used to estimate the attractiveness of Avid Technology, Inc. (NASDAQ:AVID) as an investment opportunity by taking the forecast future cash flows of the company and discounting them back to today's value. We will use the Discounted Cash Flow (DCF) model on this occasion. Models like these may appear beyond the comprehension of a lay person, but they're fairly easy to follow.
Companies can be valued in a lot of ways, so we would point out that a DCF is not perfect for every situation. If you still have some burning questions about this type of valuation, take a look at the Simply Wall St analysis model.
View our latest analysis for Avid Technology
What's The Estimated Valuation?
We're using the 2-stage growth model, which simply means we take in account two stages of company's growth. In the initial period the company may have a higher growth rate and the second stage is usually assumed to have a stable growth rate. To start off with, we need to estimate the next ten years of cash flows. Where possible we use analyst estimates, but when these aren't available we extrapolate the previous free cash flow (FCF) from the last estimate or reported value. We assume companies with shrinking free cash flow will slow their rate of shrinkage, and that companies with growing free cash flow will see their growth rate slow, over this period. We do this to reflect that growth tends to slow more in the early years than it does in later years.
A DCF is all about the idea that a dollar in the future is less valuable than a dollar today, so we need to discount the sum of these future cash flows to arrive at a present value estimate:
10-year free cash flow (FCF) estimate
| 2023 | 2024 | 2025 | 2026 | 2027 | 2028 | 2029 | 2030 | 2031 | 2032 | |
| Levered FCF ($, Millions) | US$59.9m | US$75.6m | US$87.3m | US$97.3m | US$105.6m | US$112.6m | US$118.5m | US$123.5m | US$127.9m | US$131.8m |
| Growth Rate Estimate Source | Analyst x5 | Analyst x3 | Est @ 15.47% | Est @ 11.42% | Est @ 8.59% | Est @ 6.61% | Est @ 5.22% | Est @ 4.25% | Est @ 3.57% | Est @ 3.09% |
| Present Value ($, Millions) Discounted @ 8.7% | US$55.1 | US$63.9 | US$67.9 | US$69.5 | US$69.4 | US$68.1 | US$65.9 | US$63.1 | US$60.1 | US$57.0 |
("Est" = FCF growth rate estimated by Simply Wall St)
Present Value of 10-year Cash Flow (PVCF) = US$640m
We now need to calculate the Terminal Value, which accounts for all the future cash flows after this ten year period. The Gordon Growth formula is used to calculate Terminal Value at a future annual growth rate equal to the 5-year average of the 10-year government bond yield of 2.0%. We discount the terminal cash flows to today's value at a cost of equity of 8.7%.
Terminal Value (TV)= FCF2032 × (1 + g) ÷ (r – g) = US$132m× (1 + 2.0%) ÷ (8.7%– 2.0%) = US$2.0b
Present Value of Terminal Value (PVTV)= TV / (1 + r)10= US$2.0b÷ ( 1 + 8.7%)10= US$859m
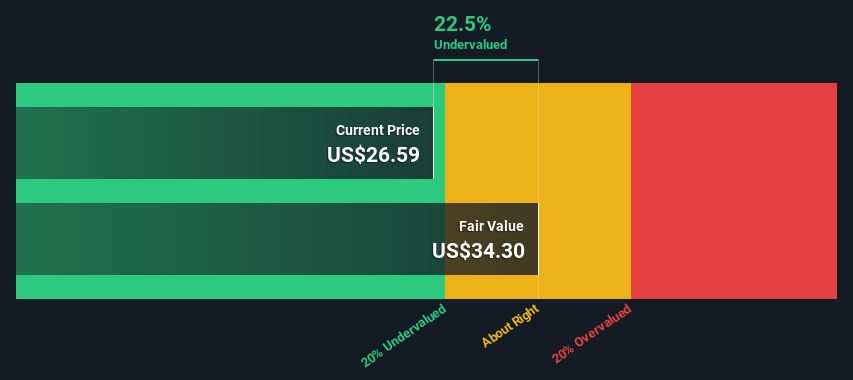
The total value is the sum of cash flows for the next ten years plus the discounted terminal value, which results in the Total Equity Value, which in this case is US$1.5b. In the final step we divide the equity value by the number of shares outstanding. Relative to the current share price of US$26.6, the company appears a touch undervalued at a 22% discount to where the stock price trades currently. Valuations are imprecise instruments though, rather like a telescope - move a few degrees and end up in a different galaxy. Do keep this in mind.
Important Assumptions
Now the most important inputs to a discounted cash flow are the discount rate, and of course, the actual cash flows. You don't have to agree with these inputs, I recommend redoing the calculations yourself and playing with them. The DCF also does not consider the possible cyclicality of an industry, or a company's future capital requirements, so it does not give a full picture of a company's potential performance. Given that we are looking at Avid Technology as potential shareholders, the cost of equity is used as the discount rate, rather than the cost of capital (or weighted average cost of capital, WACC) which accounts for debt. In this calculation we've used 8.7%, which is based on a levered beta of 1.215. Beta is a measure of a stock's volatility, compared to the market as a whole. We get our beta from the industry average beta of globally comparable companies, with an imposed limit between 0.8 and 2.0, which is a reasonable range for a stable business.
SWOT Analysis for Avid Technology
Strength
- Earnings growth over the past year exceeded the industry.
- Debt is well covered by earnings and cashflows.
Weakness
- Earnings growth over the past year is below its 5-year average.
Opportunity
- Annual earnings are forecast to grow faster than the American market.
- Trading below our estimate of fair value by more than 20%.
Threat
- Total liabilities exceed total assets, which raises the risk of financial distress.
- Revenue is forecast to grow slower than 20% per year.
Moving On:
Although the valuation of a company is important, it shouldn't be the only metric you look at when researching a company. DCF models are not the be-all and end-all of investment valuation. Preferably you'd apply different cases and assumptions and see how they would impact the company's valuation. If a company grows at a different rate, or if its cost of equity or risk free rate changes sharply, the output can look very different. Why is the intrinsic value higher than the current share price? For Avid Technology, we've put together three further items you should explore:
- Risks: You should be aware of the 3 warning signs for Avid Technology (1 is significant!) we've uncovered before considering an investment in the company.
- Management:Have insiders been ramping up their shares to take advantage of the market's sentiment for AVID's future outlook? Check out our management and board analysis with insights on CEO compensation and governance factors.
- Other Solid Businesses: Low debt, high returns on equity and good past performance are fundamental to a strong business. Why not explore our interactive list of stocks with solid business fundamentals to see if there are other companies you may not have considered!
PS. The Simply Wall St app conducts a discounted cash flow valuation for every stock on the NASDAQGS every day. If you want to find the calculation for other stocks just search here.
New: Manage All Your Stock Portfolios in One Place
We've created the ultimate portfolio companion for stock investors, and it's free.
• Connect an unlimited number of Portfolios and see your total in one currency
• Be alerted to new Warning Signs or Risks via email or mobile
• Track the Fair Value of your stocks
Have feedback on this article? Concerned about the content? Get in touch with us directly. Alternatively, email editorial-team (at) simplywallst.com.
This article by Simply Wall St is general in nature. We provide commentary based on historical data and analyst forecasts only using an unbiased methodology and our articles are not intended to be financial advice. It does not constitute a recommendation to buy or sell any stock, and does not take account of your objectives, or your financial situation. We aim to bring you long-term focused analysis driven by fundamental data. Note that our analysis may not factor in the latest price-sensitive company announcements or qualitative material. Simply Wall St has no position in any stocks mentioned.
About NasdaqGS:AVID
Avid Technology
Avid Technology, Inc., together with its subsidiaries, develops, markets, sells, and supports software and integrated solutions for video and audio content creation, management, and distribution in the United States and internationally.
Reasonable growth potential and slightly overvalued.
Similar Companies
Market Insights


Advertisement
Weekly Picks
CE


Ceazar on Sparc AI ·
When GPS fails: this small cap is fixing a $54B drone problem
Fair Value:CA$5.2533.3% undervalued
159 followersusers have followed this narrative
0 commentsusers have commented on this narrative
27 likesusers have liked this narrative
HA


HarishPK on Amdocs ·
Why Amdocs is a high conviction Buy for me?
Fair Value:US$82.0328.6% undervalued
36 followersusers have followed this narrative
3 commentsusers have commented on this narrative
12 likesusers have liked this narrative
IV

Ivoed on SBM Offshore ·
Why SBM Offshore’s €30 Share Price May Be Too Harsh On Its Backlog
Fair Value:€44.527.2% undervalued
20 followersusers have followed this narrative
0 commentsusers have commented on this narrative
5 likesusers have liked this narrative
CL


Clive_Thompson on Green Tea Group ·
One of China's Fastest-Growing Restaurant Chains Trades on Just 7x Earnings and an 8% Dividend
Fair Value:HK$8.723.9% undervalued
47 followersusers have followed this narrative
3 commentsusers have commented on this narrative
20 likesusers have liked this narrative
Recently Updated Narratives
JR

JRY on Bloom Energy ·
The Bloom Story is early days
Fair Value:US$386.143.2% undervalued
1 followerusers have followed this narrative
0 commentsusers have commented on this narrative
0 likesusers have liked this narrative
CH

ChuckN on NextEra Energy ·
Investor Thesis: Why the NextEra Energy / Dominion Energy Merger Could Be a Major AI Power Infrastructure Event
Fair Value:US$93.719.7% undervalued
23 followersusers have followed this narrative
0 commentsusers have commented on this narrative
0 likesusers have liked this narrative
TA


Talos on Voyager Technologies ·
The "Landlord of Orbit" – A Deep Value Play Ahead of the Starlab Era
Fair Value:US$385.289.1% undervalued
27 followersusers have followed this narrative
0 commentsusers have commented on this narrative
0 likesusers have liked this narrative
Popular Narratives
OS


oscargarcia on NVIDIA ·
The company that went from selling GPUs to gamers to becoming the AI arms dealer of the 21st century.
Fair Value:US$28020.0% undervalued
283 followersusers have followed this narrative
9 commentsusers have commented on this narrative
16 likesusers have liked this narrative
CU

CubanEros on Microsoft ·
A wonderful business at reasonable price.
Fair Value:US$419.9119.1% overvalued
143 followersusers have followed this narrative
0 commentsusers have commented on this narrative
8 likesusers have liked this narrative
KI

KiwiInvest on Amazon.com ·
Amazon's high growth, high tech segments propel its profits, while traditional segments plod along
Fair Value:US$475.0942.2% undervalued
167 followersusers have followed this narrative
1 commentusers have commented on this narrative
8 likesusers have liked this narrative
Trending Discussion
YA


Yash_Upadhyaya on Reddit ·
Steve blamed "choppy" Google referral traffic for the miss on US daily active user (DAU) WHILST being in a standoff with Google on the AI licensing deal... hmm 🤔 One way or another a deal is happening. What's gonna be interesting is to see how good or bad (which the market is pricing in) would it be. PS - I don't own the stock but like the company.
1
|0
