
Advertisement
- United States
- /
- Software
- /
- NYSE:SEMR
We Like These Underlying Return On Capital Trends At Semrush Holdings (NYSE:SEMR)
What are the early trends we should look for to identify a stock that could multiply in value over the long term? Ideally, a business will show two trends; firstly a growing return on capital employed (ROCE) and secondly, an increasing amount of capital employed. This shows us that it's a compounding machine, able to continually reinvest its earnings back into the business and generate higher returns. So when we looked at Semrush Holdings (NYSE:SEMR) and its trend of ROCE, we really liked what we saw.
Return On Capital Employed (ROCE): What Is It?
Just to clarify if you're unsure, ROCE is a metric for evaluating how much pre-tax income (in percentage terms) a company earns on the capital invested in its business. To calculate this metric for Semrush Holdings, this is the formula:
Return on Capital Employed = Earnings Before Interest and Tax (EBIT) ÷ (Total Assets - Current Liabilities)
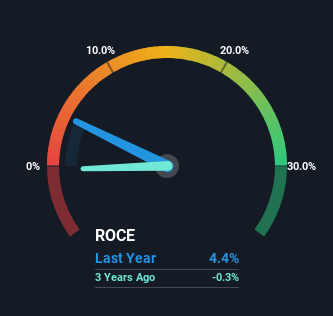
0.044 = US$11m ÷ (US$373m - US$112m) (Based on the trailing twelve months to June 2024).
So, Semrush Holdings has an ROCE of 4.4%. Ultimately, that's a low return and it under-performs the Software industry average of 8.6%.
Check out our latest analysis for Semrush Holdings
Above you can see how the current ROCE for Semrush Holdings compares to its prior returns on capital, but there's only so much you can tell from the past. If you'd like, you can check out the forecasts from the analysts covering Semrush Holdings for free.
What Can We Tell From Semrush Holdings' ROCE Trend?
Semrush Holdings has recently broken into profitability so their prior investments seem to be paying off. Shareholders would no doubt be pleased with this because the business was loss-making four years ago but is is now generating 4.4% on its capital. In addition to that, Semrush Holdings is employing 1,663% more capital than previously which is expected of a company that's trying to break into profitability. This can tell us that the company has plenty of reinvestment opportunities that are able to generate higher returns.
In another part of our analysis, we noticed that the company's ratio of current liabilities to total assets decreased to 30%, which broadly means the business is relying less on its suppliers or short-term creditors to fund its operations. So shareholders would be pleased that the growth in returns has mostly come from underlying business performance.
In Conclusion...
Long story short, we're delighted to see that Semrush Holdings' reinvestment activities have paid off and the company is now profitable. Astute investors may have an opportunity here because the stock has declined 45% in the last three years. With that in mind, we believe the promising trends warrant this stock for further investigation.
On a final note, we've found 2 warning signs for Semrush Holdings that we think you should be aware of.
While Semrush Holdings isn't earning the highest return, check out this free list of companies that are earning high returns on equity with solid balance sheets.
New: Manage All Your Stock Portfolios in One Place
We've created the ultimate portfolio companion for stock investors, and it's free.
• Connect an unlimited number of Portfolios and see your total in one currency
• Be alerted to new Warning Signs or Risks via email or mobile
• Track the Fair Value of your stocks
Have feedback on this article? Concerned about the content? Get in touch with us directly. Alternatively, email editorial-team (at) simplywallst.com.
This article by Simply Wall St is general in nature. We provide commentary based on historical data and analyst forecasts only using an unbiased methodology and our articles are not intended to be financial advice. It does not constitute a recommendation to buy or sell any stock, and does not take account of your objectives, or your financial situation. We aim to bring you long-term focused analysis driven by fundamental data. Note that our analysis may not factor in the latest price-sensitive company announcements or qualitative material. Simply Wall St has no position in any stocks mentioned.
About NYSE:SEMR
Semrush Holdings
Develops an online visibility management software-as-a-service platform in the United States, the United Kingdom, and internationally.
Flawless balance sheet with high growth potential.
Similar Companies
Market Insights

Advertisement
Community Narratives
MicroVision will explode future revenue by 380.37% with a vision towards success
Fair Value US$60.00|98.4% undervalued
TH
Community Contributor
The Indispensable Artery for a New North American Economy
Fair Value CA$132.87|1.3% undervalued
TI
Community Contributor