Advertisement
When it comes to unprofitable companies, guidance and ARR matter to investors more than short-term earnings surprises.
A few days ago, this proved true once again, as UiPath Inc. (NYSE: PATH)sank to a new low following the positive surprise on the earnings. This article will examine its current intrinsic value based on the Discounted Cash Flow (DCF) model.
Companies can be valued in many ways, so we would point out that a DCF is not perfect for every situation. For those keen learners of equity analysis, the SimplyWall St analysis model here may be something of interest to you.
See our latest analysis for UiPath.
Q2 Results
- Non-GAAP EPS: US$0.01 (beat by US$0.07)
- GAAP EPS: -US$0.19 (beat by US$0.01)
- Revenue: US$195.52m (beat by US$8.8m)
Despite beating the earnings results, the market was spooked by the slowdown for the second consecutive quarter, especially in one of the favored metrics – ARR.
Furthermore, the lockup expiry is now 5 weeks ahead, and the potential of insider selling is certainly spooking some investors. Yet, Cowen&Co are keeping an Outperform rating for the stock, adjusting it down to US$80 from US$84. Their analyst Bryan Bergin quoted sustainability of outsized growth in a massive total addressable market.
Our Look at the Valuation
Companies can be valued in many ways, so we would point out that a DCF is not perfect for every situation. For those keen learners of equity analysis, the Simply Wall St analysis model here may be something of interest to you.
See our latest analysis for UiPath.
Building the Model
We will use a two-stage DCF model, which, as the name states, considers two stages of growth. The first stage is generally a higher growth period, heading towards the terminal value, captured in the second 'steady growth' period.
To start, we need to estimate the next ten years of cash flows. Where possible, we use analyst estimates, but when these aren't available, we extrapolate the previous free cash flow (FCF) from the last estimate or reported value. We assume companies with shrinking free cash flow will slow their rate of shrinkage and that companies with growing free cash flow will see their growth rate slow over this period. We do this to reflect that growth tends to slow more in the early years than in later years.
Generally, we assume that a dollar today is more valuable than a dollar in the future, and so the sum of these future cash flows is then discounted to today's value:
10-year free cash flow (FCF) estimate
| 2022 | 2023 | 2024 | 2025 | 2026 | 2027 | 2028 | 2029 | 2030 | 2031 | |
| Levered FCF ($, Millions) | -US$22.9m | -US$5.39m | US$53.7m | US$258.1m | US$457.2m | US$624.0m | US$787.1m | US$935.7m | US$1.07b | US$1.17b |
| Growth Rate Estimate Source | Analyst x13 | Analyst x15 | Analyst x9 | Analyst x2 | Analyst x2 | Est @ 36.48% | Est @ 26.13% | Est @ 18.89% | Est @ 13.82% | Est @ 10.27% |
| Present Value ($, Millions) Discounted @ 6.5% | -US$21.5 | -US$4.8 | US$44.5 | US$201 | US$334 | US$429 | US$508 | US$567 | US$606 | US$628 |
("Est" = FCF growth rate estimated by Simply Wall St)
Present Value of 10-year Cash Flow (PVCF) = US$3.3b
We now need to calculate the Terminal Value, which accounts for all the future cash flows after this ten-year period. The Gordon Growth formula is used to calculate Terminal Value at a future annual growth rate equal to the 5-year average of the 10-year government bond yield of 2.0%. We discount the terminal cash flows to today's value at the cost of equity of 6.5%.
Terminal Value (TV)= FCF2031 × (1 + g) ÷ (r - g) = US$1.2b× (1 + 2.0%) ÷ (6.5%- 2.0%) = US$27b
Present Value of Terminal Value (PVTV)= TV / (1 + r)10= US$27b÷ ( 1 + 6.5%)10= US$14b
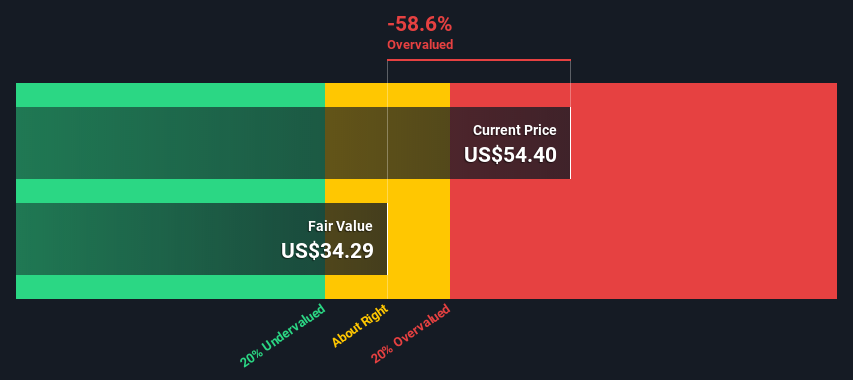
The total value, or equity value, is then the sum of the present value of the future cash flows, which in this case is US$18b. To get the intrinsic value per share, we divide this by the total number of shares outstanding.
Relative to the current share price of US$54.4, the company appears potentially overvalued, and so the big question becomes: why is this stock so pricey? Keep in mind that valuations aren't perfect, as small input adjustment makes a big difference. Do keep this in mind.
The assumptions
Now the most important inputs to a discounted cash flow are the discount rate, and of course, the actual cash flows. You don't have to agree with these inputs. You can always play with the formula and use your own.
The DCF does not consider the possible cyclicality of an industry or a company's future capital requirements, so it does not give a full picture of its potential performance. Given that we are looking at UiPath as potential shareholders, the cost of equity is used as the discount rate rather than the cost of capital (or the weighted average cost of capital, WACC), which accounts for debt.
We've used 6.5% in this calculation, which is based on a levered beta of 0.947. Beta is a measure of a stock's volatility compared to the market as a whole. We get our beta from the industry average beta of globally comparable companies, with an imposed limit between 0.8 and 2.0, a reasonable range for a stable business.
Next Steps:
Although the valuation of a company is important, it shouldn't be the only metric you look at when researching a company. The DCF model is not a perfect stock valuation tool. Rather it should be seen as a guide to "what assumptions need to be true for this stock to be under/overvalued?" For instance, if the terminal value growth rate is adjusted slightly, it can dramatically alter the overall result.
Can we work out why the company is trading at a premium to intrinsic value? Is it the high growth potential while carrying virtually no debt?
For UiPath, we've put together three additional items you should consider:
- Risks: For instance, we've identified 3 warning signs for UiPath that you should be aware of.
- Future Earnings: How does PATH's growth rate compare to its peers and the wider market? Dig deeper into the analyst consensus number for the upcoming years by interacting with our free analyst growth expectation chart.
- Other Solid Businesses: Low debt, high returns on equity, and good past performance are fundamental to a strong business. Why not explore our interactive list of stocks with solid business fundamentals to see if there are other companies you may not have considered!
PS. Simply Wall St updates its DCF calculation for every American stock every day, so if you want to find the intrinsic value of any other stock, search here.
New: AI Stock Screener & Alerts
Our new AI Stock Screener scans the market every day to uncover opportunities.
• Dividend Powerhouses (3%+ Yield)
• Undervalued Small Caps with Insider Buying
• High growth Tech and AI Companies
Or build your own from over 50 metrics.
Have feedback on this article? Concerned about the content? Get in touch with us directly. Alternatively, email editorial-team@simplywallst.com
Simply Wall St analyst Stjepan Kalinic and Simply Wall St have no position in any of the companies mentioned. This article is general in nature. We provide commentary based on historical data and analyst forecasts only using an unbiased methodology and our articles are not intended to be financial advice. It does not constitute a recommendation to buy or sell any stock and does not take account of your objectives, or your financial situation. We aim to bring you long-term focused analysis driven by fundamental data. Note that our analysis may not factor in the latest price-sensitive company announcements or qualitative material.

Stjepan Kalinic
Stjepan is a writer and an analyst covering equity markets. As a former multi-asset analyst, he prefers to look beyond the surface and uncover ideas that might not be on retail investors' radar. You can find his research all over the internet, including Simply Wall St News, Yahoo Finance, Benzinga, Vincent, and Barron's.
About NYSE:PATH
UiPath
Provides an end-to-end automation platform that offers a range of robotic process automation (RPA) solutions primarily in the United States, Romania, the United Kingdom, the Netherlands, and internationally.
Flawless balance sheet with low risk.
Similar Companies
Market Insights

Advertisement
Weekly Picks
RO


RockeTeller on Santacruz Silver Mining ·
Crazy Undervalued 42 Baggers Silver Play (Active & Running Mine)
Fair Value:CA$8696.7% undervalued
59 followersusers have followed this narrative
7 commentsusers have commented on this narrative
17 likesusers have liked this narrative
RO


Robbo on Fiducian Group ·
Fiducian: Compliance Clouds or Value Opportunity?
Fair Value:AU$122.0% undervalued
9 followersusers have followed this narrative
0 commentsusers have commented on this narrative
0 likesusers have liked this narrative
WO

woodworthfund on Willamette Valley Vineyards ·
Willamette Valley Vineyards (WVVI): Not-So-Great Value
Fair Value:US$242.5% overvalued
10 followersusers have followed this narrative
0 commentsusers have commented on this narrative
1 likeusers have liked this narrative
Recently Updated Narratives
WO

woodworthfund on MGP Ingredients ·
THE KINGDOM OF BROWN GOODS: WHY MGPI IS BEING CRUSHED BY INVENTORY & PRIMED FOR RESURRECTION
Fair Value:US$4035.8% undervalued
3 followersusers have followed this narrative
0 commentsusers have commented on this narrative
0 likesusers have liked this narrative
DA


davidlsander on Beam Therapeutics ·
The "Molecular Pencil": Why Beam's Technology is Built to Win
Fair Value:US$15081.9% undervalued
50 followersusers have followed this narrative
3 commentsusers have commented on this narrative
1 likeusers have liked this narrative
MO


mo7md on ADNOC Gas ·
ADNOC Gas future shines with a 21.4% revenue surge
Fair Value:د.إ3.728.9% undervalued
3 followersusers have followed this narrative
0 commentsusers have commented on this narrative
0 likesusers have liked this narrative
Popular Narratives
TH


TheWallstreetKing on MicroVision ·
MicroVision will explode future revenue by 380.37% with a vision towards success
Fair Value:US$6098.5% undervalued
117 followersusers have followed this narrative
11 commentsusers have commented on this narrative
22 likesusers have liked this narrative
AN


AnalystConsensusTarget on NVIDIA ·
NVDA: Expanding AI Demand Will Drive Major Data Center Investments Through 2026
Fair Value:US$250.3927.2% undervalued
959 followersusers have followed this narrative
6 commentsusers have commented on this narrative
25 likesusers have liked this narrative
RO
RockeTeller on Santacruz Silver Mining ·
Crazy Undervalued 42 Baggers Silver Play (Active & Running Mine)
Fair Value:CA$8696.7% undervalued
59 followersusers have followed this narrative
7 commentsusers have commented on this narrative
17 likesusers have liked this narrative
