- United States
- /
- Diversified Financial
- /
- NYSE:EVTC
Does EVERTEC, Inc.'s (NYSE:EVTC) P/E Ratio Signal A Buying Opportunity?

Want to participate in a short research study? Help shape the future of investing tools and you could win a $250 gift card!
This article is for investors who would like to improve their understanding of price to earnings ratios (P/E ratios). We'll apply a basic P/E ratio analysis to EVERTEC, Inc.'s (NYSE:EVTC), to help you decide if the stock is worth further research. What is EVERTEC's P/E ratio? Well, based on the last twelve months it is 26.78. In other words, at today's prices, investors are paying $26.78 for every $1 in prior year profit.
See our latest analysis for EVERTEC
How Do I Calculate A Price To Earnings Ratio?
The formula for price to earnings is:
Price to Earnings Ratio = Share Price ÷ Earnings per Share (EPS)
Or for EVERTEC:
P/E of 26.78 = $33.16 ÷ $1.24 (Based on the trailing twelve months to March 2019.)
Is A High P/E Ratio Good?
A higher P/E ratio implies that investors pay a higher price for the earning power of the business. That is not a good or a bad thing per se, but a high P/E does imply buyers are optimistic about the future.
Does EVERTEC Have A Relatively High Or Low P/E For Its Industry?
We can get an indication of market expectations by looking at the P/E ratio. The image below shows that EVERTEC has a lower P/E than the average (36.3) P/E for companies in the it industry.
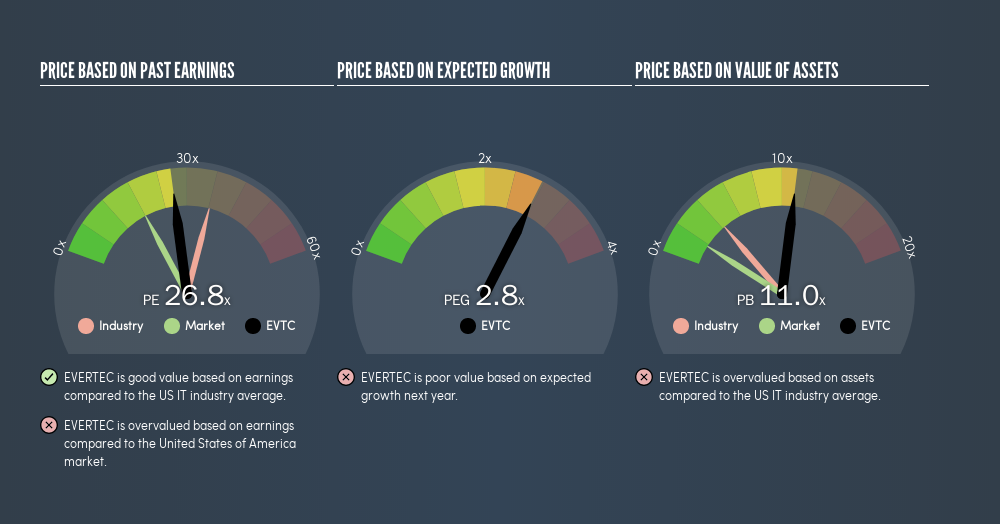
EVERTEC's P/E tells us that market participants think it will not fare as well as its peers in the same industry.
How Growth Rates Impact P/E Ratios
P/E ratios primarily reflect market expectations around earnings growth rates. Earnings growth means that in the future the 'E' will be higher. Therefore, even if you pay a high multiple of earnings now, that multiple will become lower in the future. And as that P/E ratio drops, the company will look cheap, unless its share price increases.
EVERTEC's 63% EPS improvement over the last year was like bamboo growth after rain; rapid and impressive. Having said that, the average EPS growth over the last three years wasn't so good, coming in at 3.2%.
Remember: P/E Ratios Don't Consider The Balance Sheet
It's important to note that the P/E ratio considers the market capitalization, not the enterprise value. Thus, the metric does not reflect cash or debt held by the company. Hypothetically, a company could reduce its future P/E ratio by spending its cash (or taking on debt) to achieve higher earnings.
Such expenditure might be good or bad, in the long term, but the point here is that the balance sheet is not reflected by this ratio.
So What Does EVERTEC's Balance Sheet Tell Us?
EVERTEC's net debt is 21% of its market cap. It would probably deserve a higher P/E ratio if it was net cash, since it would have more options for growth.
The Verdict On EVERTEC's P/E Ratio
EVERTEC has a P/E of 26.8. That's higher than the average in its market, which is 18. The company is not overly constrained by its modest debt levels, and its recent EPS growth is nothing short of stand-out. So to be frank we are not surprised it has a high P/E ratio.
Investors have an opportunity when market expectations about a stock are wrong. People often underestimate remarkable growth -- so investors can make money when fast growth is not fully appreciated. So this free visualization of the analyst consensus on future earnings could help you make the right decision about whether to buy, sell, or hold.
You might be able to find a better buy than EVERTEC. If you want a selection of possible winners, check out this free list of interesting companies that trade on a P/E below 20 (but have proven they can grow earnings).
We aim to bring you long-term focused research analysis driven by fundamental data. Note that our analysis may not factor in the latest price-sensitive company announcements or qualitative material.
If you spot an error that warrants correction, please contact the editor at editorial-team@simplywallst.com. This article by Simply Wall St is general in nature. It does not constitute a recommendation to buy or sell any stock, and does not take account of your objectives, or your financial situation. Simply Wall St has no position in the stocks mentioned. Thank you for reading.
About NYSE:EVTC
EVERTEC
Provides transaction processing and financial technology services in Latin America, Puerto Rico, and the Caribbean.
Undervalued with proven track record.
Similar Companies
Market Insights

Weekly Picks

Early mover in a fast growing industry. Likely to experience share price volatility as they scale


A case for CA$31.80 (undiluted), aka 8,616% upside from CA$0.37 (an 86 bagger!).


Moderation and Stabilisation: HOLD: Fair Price based on a 4-year Cycle is $12.08
Recently Updated Narratives

Meta’s Bold Bet on AI Pays Off

ADP Stock: Solid Fundamentals, But AI Investments Test Its Margin Resilience

Visa Stock: The Toll Booth at the Center of Global Commerce
Popular Narratives


Crazy Undervalued 42 Baggers Silver Play (Active & Running Mine)


NVDA: Expanding AI Demand Will Drive Major Data Center Investments Through 2026

The AI Infrastructure Giant Grows Into Its Valuation
Trending Discussion


