Advertisement
- United States
- /
- Software
- /
- NYSE:DT
Has Dynatrace’s AI Expansion Shifted Its Valuation Opportunity in 2025?

Simply Wall St
Reviewed by Bailey Pemberton
- Wondering if Dynatrace is a bargain or overpriced? If you have ever questioned whether now is the right time to invest, you are definitely not alone.
- After a string of ups and downs, Dynatrace’s share price is at $50.48. The stock is down 0.1% this week but up 1.8% over the last month, with year-to-date and one-year returns both dipping about -7%.
- Recent news has shaped the market’s mood, including Dynatrace’s announced enhancements to their AI capabilities, which could strengthen its competitive edge. Investor attention has also been drawn to strategic partnerships expanding its platform reach, keeping sentiment lively even as the stock finds its footing after recent swings.
- Right now, Dynatrace earns a 5 out of 6 valuation score for being undervalued across multiple key metrics. Stick around as we break down how this is calculated using classic valuation approaches, and reveal a smarter way to think about fair value by the end of this article.
Find out why Dynatrace's -7.5% return over the last year is lagging behind its peers.
Approach 1: Dynatrace Discounted Cash Flow (DCF) Analysis
The Discounted Cash Flow (DCF) model is a classic approach to valuation. It estimates a company's intrinsic value by projecting its future cash flows and discounting them back to today's dollars. This method helps investors understand how much a business is worth based on its ability to generate cash moving forward, rather than just its current profits.
For Dynatrace, the current Free Cash Flow stands at $464 million. Analyst estimates provide detailed forecasts for the next five years, projecting healthy growth in annual cash flows. Over the next decade, Simply Wall St extrapolates further, anticipating Free Cash Flow to reach $1.1 billion by 2030. These long-term projections reflect Dynatrace's potential to steadily expand its cash generation in the software sector.
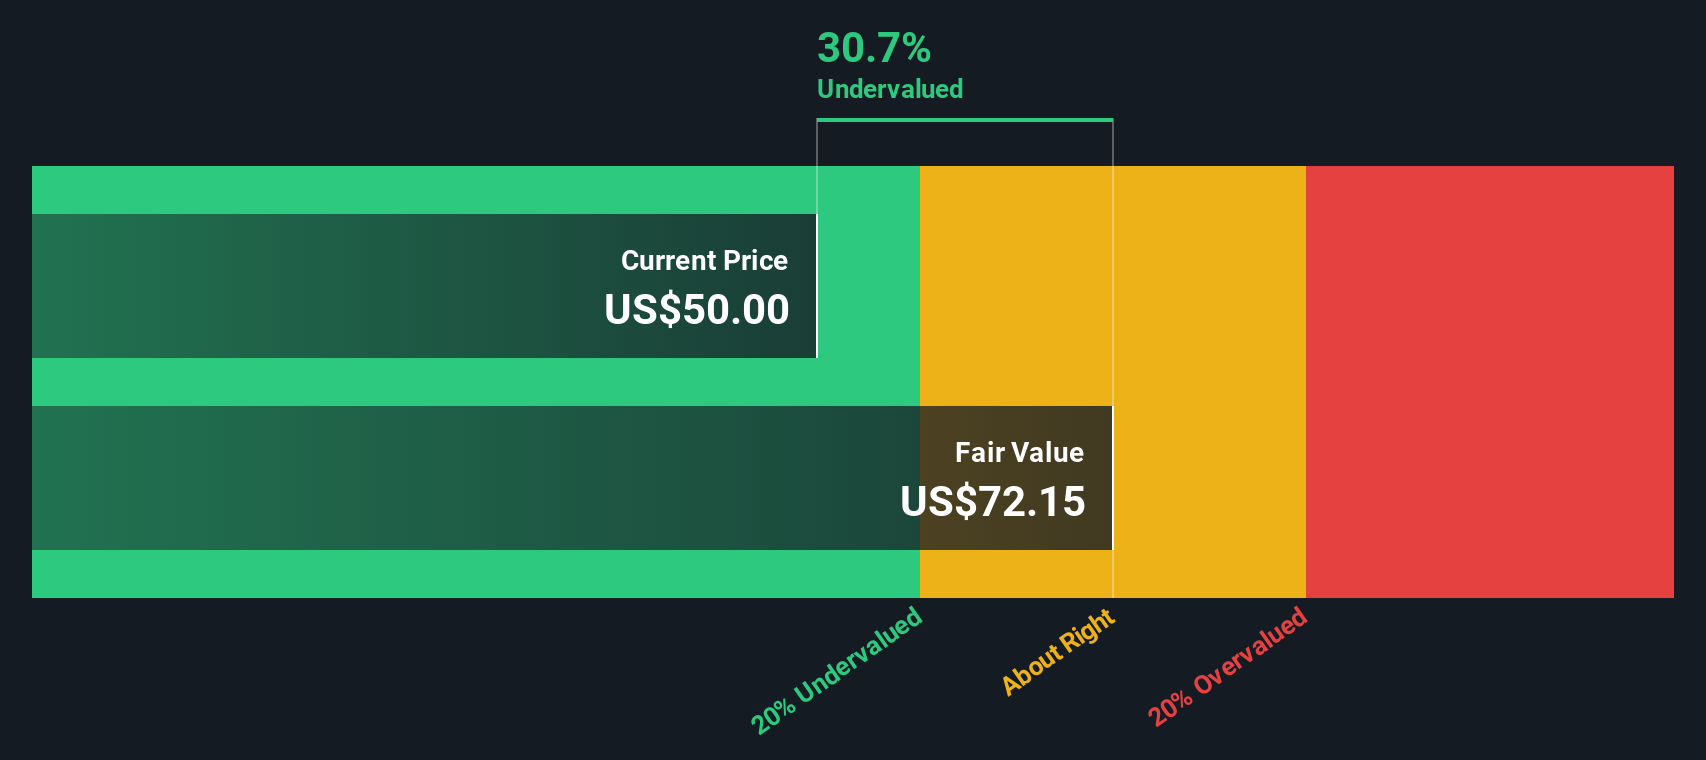
Based on these forward-looking cash flows and using the 2 Stage Free Cash Flow to Equity model, the DCF analysis places Dynatrace's fair value at $71.89 per share. With the current share price at $50.48, the model indicates the stock is trading at a 29.8% discount to its intrinsic value. By DCF standards, this is a compelling signal.
Result: UNDERVALUED
Our Discounted Cash Flow (DCF) analysis suggests Dynatrace is undervalued by 29.8%. Track this in your watchlist or portfolio, or discover 843 more undervalued stocks based on cash flows.
Approach 2: Dynatrace Price vs Earnings
The Price-to-Earnings (PE) ratio is a commonly used metric for valuing profitable companies like Dynatrace. It represents how much investors are willing to pay for each dollar of the company’s earnings, making it particularly useful when a company has a steady track record of profitability.
The “normal” or “fair” PE ratio for a stock depends on several factors including future growth prospects, how reliable that growth is, and the risks inherent in the business. Companies expected to grow faster, or with more stable cash flows, often trade at higher PE ratios than their riskier, slower-growing peers.
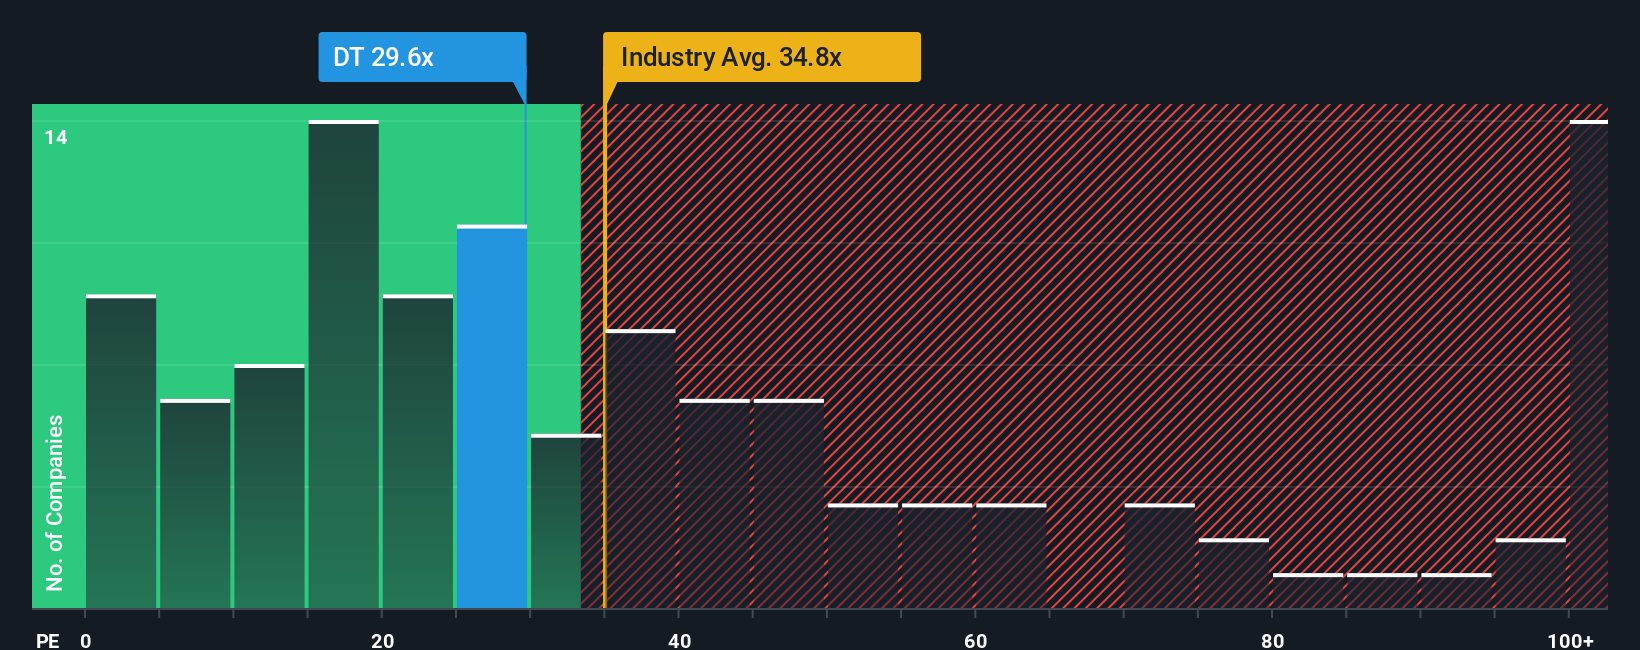
Dynatrace’s current PE ratio stands at 30.87x. For perspective, the average PE ratio in the Software industry is 35.91x, and Dynatrace’s peer average sits even higher at 66.67x. By these comparisons, Dynatrace appears conservatively valued, especially given its strong profitability.
However, Simply Wall St takes things further with its proprietary “Fair Ratio.” This metric estimates the appropriate PE ratio for Dynatrace by factoring in earnings growth, profit margins, industry dynamics, market cap, and company-specific risks. This approach goes beyond simply comparing Dynatrace to its peers or the industry by giving a holistic, tailored valuation benchmark.
According to this Fair Ratio, Dynatrace should trade at around 28.47x. Comparing this to the company’s actual PE of 30.87x, Dynatrace is trading only a touch above its fair value estimate. The difference is relatively minor, which points to the stock being reasonably priced at current levels.
Result: ABOUT RIGHT
PE ratios tell one story, but what if the real opportunity lies elsewhere? Discover 1410 companies where insiders are betting big on explosive growth.
Upgrade Your Decision Making: Choose your Dynatrace Narrative
Earlier we mentioned that there's an even better way to understand valuation, so let's introduce you to Narratives. A Narrative is a simple, powerful tool that lets you combine your outlook for a company by considering how you see its business, future revenue, and profits, together with the story behind those numbers. By linking your unique perspective to a projected financial forecast and a resulting fair value, Narratives make it easy to see how your outlook could affect investment decisions.
On Simply Wall St's Community page, millions of investors are already using Narratives to visualize whether a stock is undervalued or overpriced compared to their own assumptions. Think of Narratives as a bridge between a company's evolving story and what those changes really mean for fair value, so you can make smarter decisions about when to buy or sell.
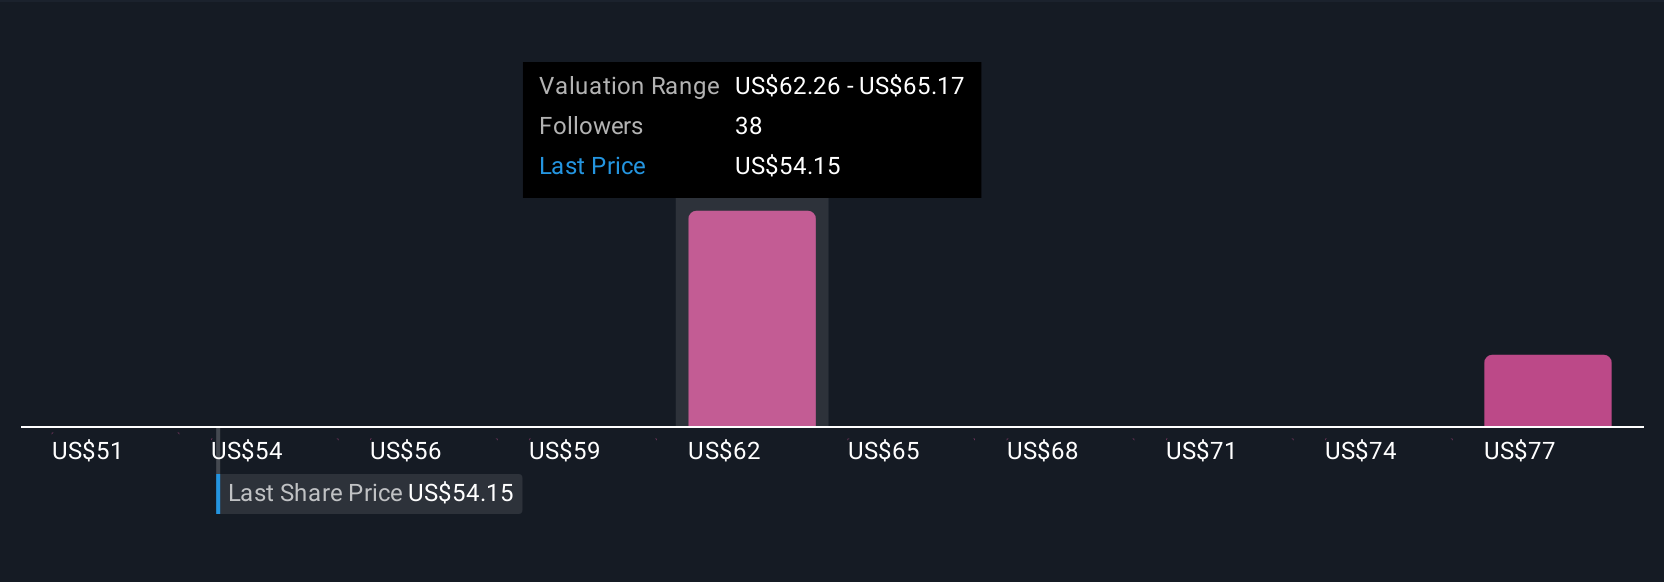
Best of all, Narratives are constantly updated whenever new news or earnings are released, helping you react quickly to fast-changing information. For example, while some investors believe Dynatrace could be worth as much as $70.00 if AI-driven growth plays out, others with a more cautious view set their fair value closer to $55.00. This demonstrates how Narratives capture both optimism and skepticism in real time.
Do you think there's more to the story for Dynatrace? Head over to our Community to see what others are saying!
This article by Simply Wall St is general in nature. We provide commentary based on historical data and analyst forecasts only using an unbiased methodology and our articles are not intended to be financial advice. It does not constitute a recommendation to buy or sell any stock, and does not take account of your objectives, or your financial situation. We aim to bring you long-term focused analysis driven by fundamental data. Note that our analysis may not factor in the latest price-sensitive company announcements or qualitative material. Simply Wall St has no position in any stocks mentioned.
New: Manage All Your Stock Portfolios in One Place
We've created the ultimate portfolio companion for stock investors, and it's free.
• Connect an unlimited number of Portfolios and see your total in one currency
• Be alerted to new Warning Signs or Risks via email or mobile
• Track the Fair Value of your stocks
Have feedback on this article? Concerned about the content? Get in touch with us directly. Alternatively, email editorial-team@simplywallst.com
About NYSE:DT
Dynatrace
Engages in the advancement of observability for digital businesses, which transforms the complexity of modern digital ecosystems in North America, Europe, the Middle East, Africa, the Asia Pacific, and Latin America.
Flawless balance sheet and undervalued.
Similar Companies
Market Insights

Advertisement
Community Narratives
The company that turned a verb into a global necessity and basically runs the modern internet, digital ads, smartphones, maps, and AI.
Fair Value US$300.00|5.4% undervalued
OS
Community Contributor
Flowers Foods Pays A Fair Price For Health
Fair Value US$16.12|26.3% undervalued
NV
Community Contributor
TMX Group will thrive with 33.3% profit margin and enduring market moat
Fair Value CA$49.90|4.1% overvalued
LI
Community Contributor
The "Molecular Pencil": Why Beam's Technology is Built to Win
Fair Value US$65.01|62.7% undervalued
DA
Community Contributor