
Advertisement
David Iben put it well when he said, 'Volatility is not a risk we care about. What we care about is avoiding the permanent loss of capital.' When we think about how risky a company is, we always like to look at its use of debt, since debt overload can lead to ruin. We can see that CI&T Inc. (NYSE:CINT) does use debt in its business. But the real question is whether this debt is making the company risky.
What Risk Does Debt Bring?
Debt is a tool to help businesses grow, but if a business is incapable of paying off its lenders, then it exists at their mercy. In the worst case scenario, a company can go bankrupt if it cannot pay its creditors. However, a more usual (but still expensive) situation is where a company must dilute shareholders at a cheap share price simply to get debt under control. Of course, debt can be an important tool in businesses, particularly capital heavy businesses. The first step when considering a company's debt levels is to consider its cash and debt together.
View our latest analysis for CI&T
What Is CI&T's Net Debt?
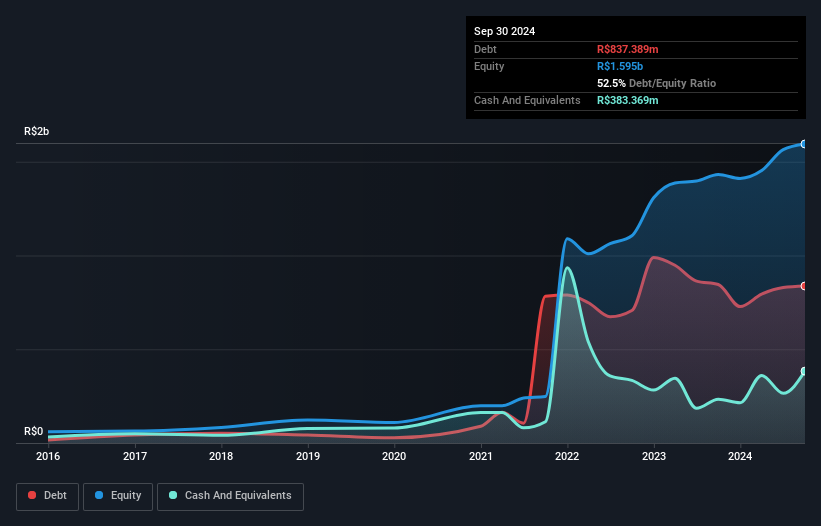
As you can see below, CI&T had R$837.4m of debt, at September 2024, which is about the same as the year before. You can click the chart for greater detail. However, it does have R$383.4m in cash offsetting this, leading to net debt of about R$454.0m.
How Strong Is CI&T's Balance Sheet?
Zooming in on the latest balance sheet data, we can see that CI&T had liabilities of R$749.8m due within 12 months and liabilities of R$755.3m due beyond that. Offsetting this, it had R$383.4m in cash and R$744.0m in receivables that were due within 12 months. So its liabilities total R$377.7m more than the combination of its cash and short-term receivables.
Since publicly traded CI&T shares are worth a total of R$5.61b, it seems unlikely that this level of liabilities would be a major threat. But there are sufficient liabilities that we would certainly recommend shareholders continue to monitor the balance sheet, going forward.
We measure a company's debt load relative to its earnings power by looking at its net debt divided by its earnings before interest, tax, depreciation, and amortization (EBITDA) and by calculating how easily its earnings before interest and tax (EBIT) cover its interest expense (interest cover). Thus we consider debt relative to earnings both with and without depreciation and amortization expenses.
CI&T has net debt worth 1.5 times EBITDA, which isn't too much, but its interest cover looks a bit on the low side, with EBIT at only 4.0 times the interest expense. While these numbers do not alarm us, it's worth noting that the cost of the company's debt is having a real impact. Unfortunately, CI&T's EBIT flopped 18% over the last four quarters. If earnings continue to decline at that rate then handling the debt will be more difficult than taking three children under 5 to a fancy pants restaurant. When analysing debt levels, the balance sheet is the obvious place to start. But ultimately the future profitability of the business will decide if CI&T can strengthen its balance sheet over time. So if you want to see what the professionals think, you might find this free report on analyst profit forecasts to be interesting.
But our final consideration is also important, because a company cannot pay debt with paper profits; it needs cold hard cash. So it's worth checking how much of that EBIT is backed by free cash flow. During the last three years, CI&T produced sturdy free cash flow equating to 66% of its EBIT, about what we'd expect. This free cash flow puts the company in a good position to pay down debt, when appropriate.
Our View
CI&T's EBIT growth rate was a real negative on this analysis, although the other factors we considered were considerably better. In particular, we are dazzled with its conversion of EBIT to free cash flow. When we consider all the factors mentioned above, we do feel a bit cautious about CI&T's use of debt. While debt does have its upside in higher potential returns, we think shareholders should definitely consider how debt levels might make the stock more risky. Over time, share prices tend to follow earnings per share, so if you're interested in CI&T, you may well want to click here to check an interactive graph of its earnings per share history.
If you're interested in investing in businesses that can grow profits without the burden of debt, then check out this free list of growing businesses that have net cash on the balance sheet.
New: AI Stock Screener & Alerts
Our new AI Stock Screener scans the market every day to uncover opportunities.
• Dividend Powerhouses (3%+ Yield)
• Undervalued Small Caps with Insider Buying
• High growth Tech and AI Companies
Or build your own from over 50 metrics.
Have feedback on this article? Concerned about the content? Get in touch with us directly. Alternatively, email editorial-team (at) simplywallst.com.
This article by Simply Wall St is general in nature. We provide commentary based on historical data and analyst forecasts only using an unbiased methodology and our articles are not intended to be financial advice. It does not constitute a recommendation to buy or sell any stock, and does not take account of your objectives, or your financial situation. We aim to bring you long-term focused analysis driven by fundamental data. Note that our analysis may not factor in the latest price-sensitive company announcements or qualitative material. Simply Wall St has no position in any stocks mentioned.
About NYSE:CINT
CI&T
Provides strategy, design, and software engineering services worldwide.
Very undervalued with solid track record.
Similar Companies
Market Insights

Advertisement
Community Narratives
MicroVision will explode future revenue by 380.37% with a vision towards success
Fair Value US$60.00|98.5% undervalued
TH
Community Contributor
The Indispensable Artery for a New North American Economy
Fair Value CA$132.87|2.3% undervalued
TI
Community Contributor