
Advertisement
Howard Marks put it nicely when he said that, rather than worrying about share price volatility, 'The possibility of permanent loss is the risk I worry about... and every practical investor I know worries about.' So it seems the smart money knows that debt - which is usually involved in bankruptcies - is a very important factor, when you assess how risky a company is. As with many other companies CI&T Inc. (NYSE:CINT) makes use of debt. But should shareholders be worried about its use of debt?
What Risk Does Debt Bring?
Debt is a tool to help businesses grow, but if a business is incapable of paying off its lenders, then it exists at their mercy. Part and parcel of capitalism is the process of 'creative destruction' where failed businesses are mercilessly liquidated by their bankers. However, a more usual (but still expensive) situation is where a company must dilute shareholders at a cheap share price simply to get debt under control. Of course, the upside of debt is that it often represents cheap capital, especially when it replaces dilution in a company with the ability to reinvest at high rates of return. The first thing to do when considering how much debt a business uses is to look at its cash and debt together.
What Is CI&T's Net Debt?
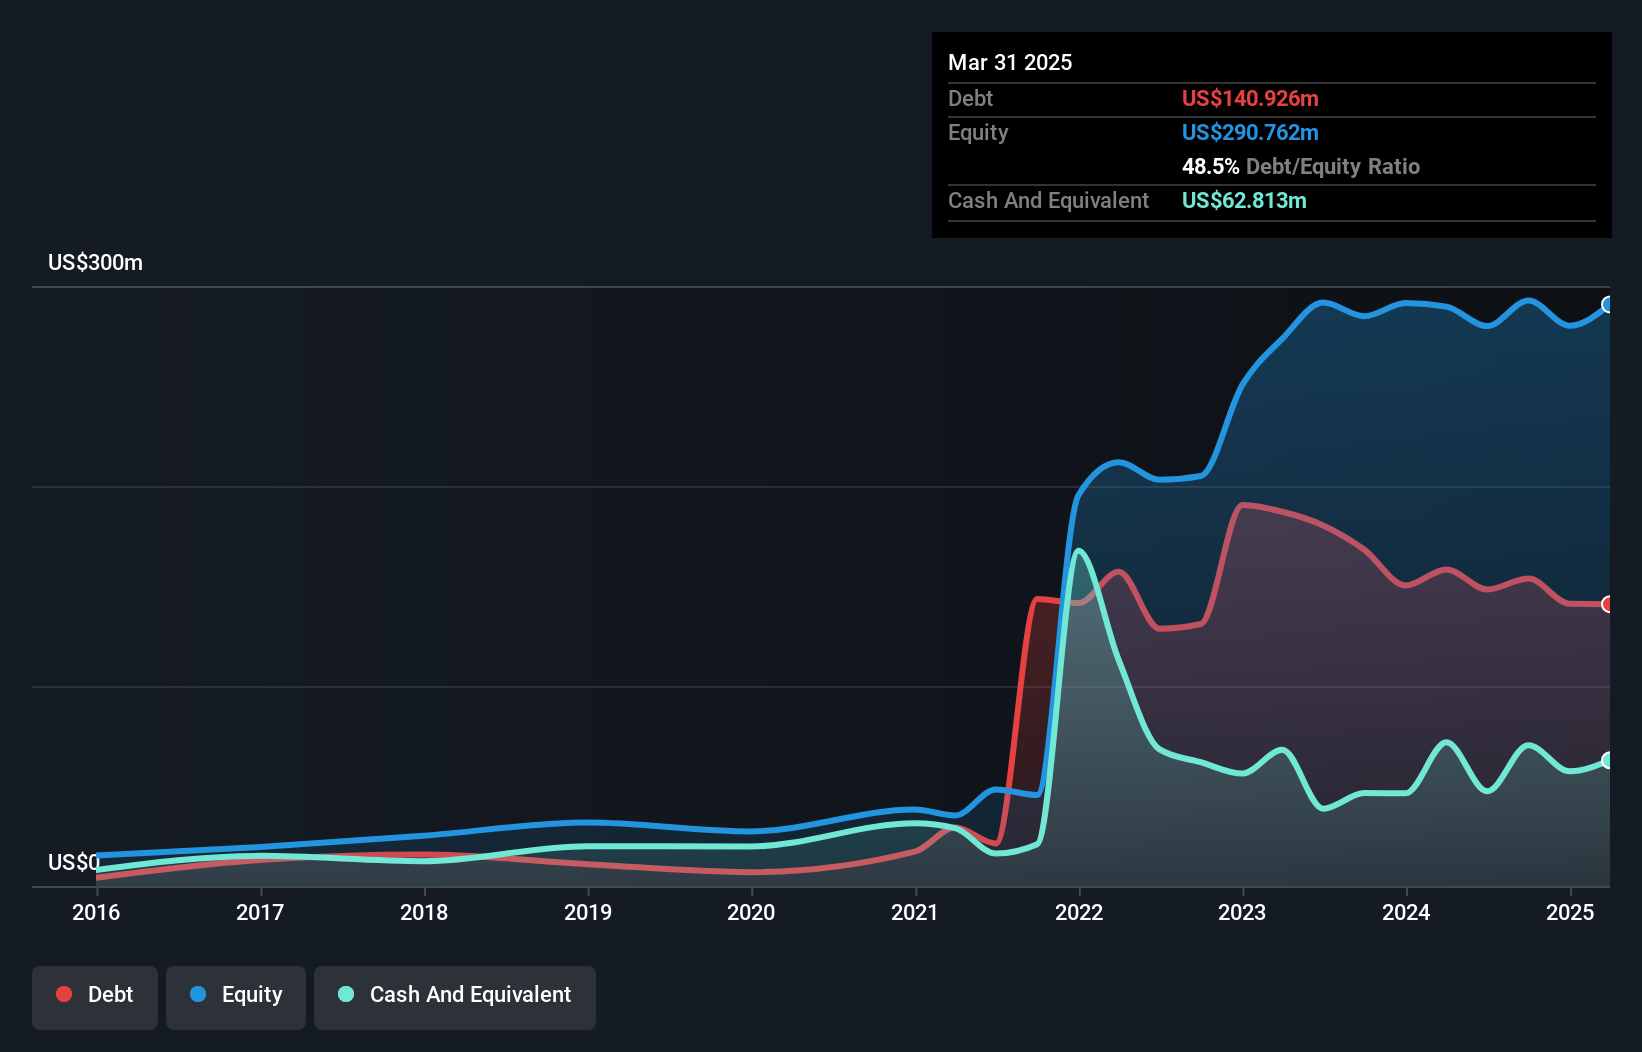
The image below, which you can click on for greater detail, shows that CI&T had debt of US$140.9m at the end of March 2025, a reduction from US$158.3m over a year. However, because it has a cash reserve of US$62.8m, its net debt is less, at about US$78.1m.
A Look At CI&T's Liabilities
The latest balance sheet data shows that CI&T had liabilities of US$123.8m due within a year, and liabilities of US$123.7m falling due after that. Offsetting these obligations, it had cash of US$62.8m as well as receivables valued at US$121.7m due within 12 months. So its liabilities total US$62.9m more than the combination of its cash and short-term receivables.
Given CI&T has a market capitalization of US$750.3m, it's hard to believe these liabilities pose much threat. But there are sufficient liabilities that we would certainly recommend shareholders continue to monitor the balance sheet, going forward.
Check out our latest analysis for CI&T
We use two main ratios to inform us about debt levels relative to earnings. The first is net debt divided by earnings before interest, tax, depreciation, and amortization (EBITDA), while the second is how many times its earnings before interest and tax (EBIT) covers its interest expense (or its interest cover, for short). This way, we consider both the absolute quantum of the debt, as well as the interest rates paid on it.
CI&T has net debt of just 1.1 times EBITDA, suggesting it could ramp leverage without breaking a sweat. But the really cool thing is that it actually managed to receive more interest than it paid, over the last year. So it's fair to say it can handle debt like a hotshot teppanyaki chef handles cooking. Also good is that CI&T grew its EBIT at 17% over the last year, further increasing its ability to manage debt. When analysing debt levels, the balance sheet is the obvious place to start. But it is future earnings, more than anything, that will determine CI&T's ability to maintain a healthy balance sheet going forward. So if you're focused on the future you can check out this free report showing analyst profit forecasts.
Finally, while the tax-man may adore accounting profits, lenders only accept cold hard cash. So the logical step is to look at the proportion of that EBIT that is matched by actual free cash flow. During the last three years, CI&T generated free cash flow amounting to a very robust 87% of its EBIT, more than we'd expect. That positions it well to pay down debt if desirable to do so.
Our View
Happily, CI&T's impressive interest cover implies it has the upper hand on its debt. And that's just the beginning of the good news since its conversion of EBIT to free cash flow is also very heartening. Considering this range of factors, it seems to us that CI&T is quite prudent with its debt, and the risks seem well managed. So we're not worried about the use of a little leverage on the balance sheet. Over time, share prices tend to follow earnings per share, so if you're interested in CI&T, you may well want to click here to check an interactive graph of its earnings per share history.
Of course, if you're the type of investor who prefers buying stocks without the burden of debt, then don't hesitate to discover our exclusive list of net cash growth stocks, today.
New: AI Stock Screener & Alerts
Our new AI Stock Screener scans the market every day to uncover opportunities.
• Dividend Powerhouses (3%+ Yield)
• Undervalued Small Caps with Insider Buying
• High growth Tech and AI Companies
Or build your own from over 50 metrics.
Have feedback on this article? Concerned about the content? Get in touch with us directly. Alternatively, email editorial-team (at) simplywallst.com.
This article by Simply Wall St is general in nature. We provide commentary based on historical data and analyst forecasts only using an unbiased methodology and our articles are not intended to be financial advice. It does not constitute a recommendation to buy or sell any stock, and does not take account of your objectives, or your financial situation. We aim to bring you long-term focused analysis driven by fundamental data. Note that our analysis may not factor in the latest price-sensitive company announcements or qualitative material. Simply Wall St has no position in any stocks mentioned.
About NYSE:CINT
CI&T
Provides strategy, design, and software engineering services worldwide.
Very undervalued with solid track record.
Similar Companies
Market Insights

Advertisement
Community Narratives
MicroVision will explode future revenue by 380.37% with a vision towards success
Fair Value US$60.00|98.5% undervalued
TH
Community Contributor
The Indispensable Artery for a New North American Economy
Fair Value CA$132.87|2.3% undervalued
TI
Community Contributor