- United States
- /
- Software
- /
- NYSE:BKI
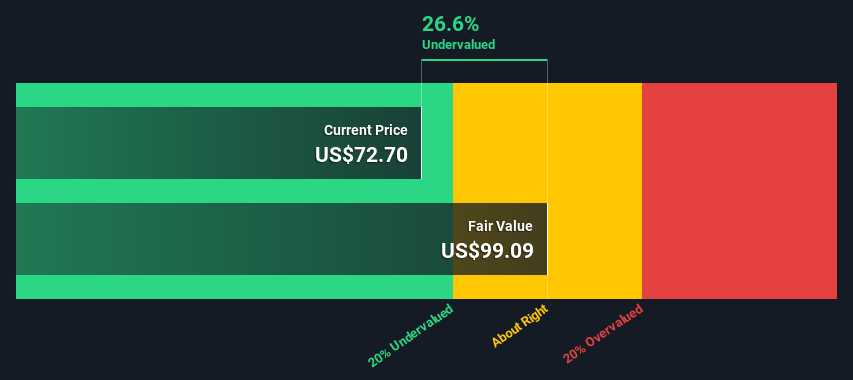
Black Knight, Inc.'s (NYSE:BKI) Intrinsic Value Is Potentially 36% Above Its Share Price


Does the January share price for Black Knight, Inc. (NYSE:BKI) reflect what it's really worth? Today, we will estimate the stock's intrinsic value by estimating the company's future cash flows and discounting them to their present value. One way to achieve this is by employing the Discounted Cash Flow (DCF) model. Don't get put off by the jargon, the math behind it is actually quite straightforward.
Companies can be valued in a lot of ways, so we would point out that a DCF is not perfect for every situation. If you want to learn more about discounted cash flow, the rationale behind this calculation can be read in detail in the Simply Wall St analysis model.
Check out our latest analysis for Black Knight
The method
We are going to use a two-stage DCF model, which, as the name states, takes into account two stages of growth. The first stage is generally a higher growth period which levels off heading towards the terminal value, captured in the second 'steady growth' period. To start off with, we need to estimate the next ten years of cash flows. Where possible we use analyst estimates, but when these aren't available we extrapolate the previous free cash flow (FCF) from the last estimate or reported value. We assume companies with shrinking free cash flow will slow their rate of shrinkage, and that companies with growing free cash flow will see their growth rate slow, over this period. We do this to reflect that growth tends to slow more in the early years than it does in later years.
A DCF is all about the idea that a dollar in the future is less valuable than a dollar today, so we discount the value of these future cash flows to their estimated value in today's dollars:
10-year free cash flow (FCF) forecast
| 2022 | 2023 | 2024 | 2025 | 2026 | 2027 | 2028 | 2029 | 2030 | 2031 | |
| Levered FCF ($, Millions) | US$501.7m | US$553.1m | US$646.0m | US$707.0m | US$752.2m | US$790.4m | US$823.0m | US$851.7m | US$877.5m | US$901.2m |
| Growth Rate Estimate Source | Analyst x4 | Analyst x4 | Analyst x1 | Analyst x1 | Est @ 6.4% | Est @ 5.07% | Est @ 4.13% | Est @ 3.48% | Est @ 3.03% | Est @ 2.71% |
| Present Value ($, Millions) Discounted @ 6.7% | US$470 | US$486 | US$532 | US$546 | US$544 | US$536 | US$523 | US$507 | US$490 | US$472 |
("Est" = FCF growth rate estimated by Simply Wall St)
Present Value of 10-year Cash Flow (PVCF) = US$5.1b
We now need to calculate the Terminal Value, which accounts for all the future cash flows after this ten year period. For a number of reasons a very conservative growth rate is used that cannot exceed that of a country's GDP growth. In this case we have used the 5-year average of the 10-year government bond yield (2.0%) to estimate future growth. In the same way as with the 10-year 'growth' period, we discount future cash flows to today's value, using a cost of equity of 6.7%.
Terminal Value (TV)= FCF2031 × (1 + g) ÷ (r – g) = US$901m× (1 + 2.0%) ÷ (6.7%– 2.0%) = US$19b
Present Value of Terminal Value (PVTV)= TV / (1 + r)10= US$19b÷ ( 1 + 6.7%)10= US$10b
The total value, or equity value, is then the sum of the present value of the future cash flows, which in this case is US$15b. The last step is to then divide the equity value by the number of shares outstanding. Compared to the current share price of US$72.7, the company appears a touch undervalued at a 27% discount to where the stock price trades currently. The assumptions in any calculation have a big impact on the valuation, so it is better to view this as a rough estimate, not precise down to the last cent.
Important assumptions
Now the most important inputs to a discounted cash flow are the discount rate, and of course, the actual cash flows. Part of investing is coming up with your own evaluation of a company's future performance, so try the calculation yourself and check your own assumptions. The DCF also does not consider the possible cyclicality of an industry, or a company's future capital requirements, so it does not give a full picture of a company's potential performance. Given that we are looking at Black Knight as potential shareholders, the cost of equity is used as the discount rate, rather than the cost of capital (or weighted average cost of capital, WACC) which accounts for debt. In this calculation we've used 6.7%, which is based on a levered beta of 1.080. Beta is a measure of a stock's volatility, compared to the market as a whole. We get our beta from the industry average beta of globally comparable companies, with an imposed limit between 0.8 and 2.0, which is a reasonable range for a stable business.
Looking Ahead:
Whilst important, the DCF calculation shouldn't be the only metric you look at when researching a company. The DCF model is not a perfect stock valuation tool. Instead the best use for a DCF model is to test certain assumptions and theories to see if they would lead to the company being undervalued or overvalued. If a company grows at a different rate, or if its cost of equity or risk free rate changes sharply, the output can look very different. Can we work out why the company is trading at a discount to intrinsic value? For Black Knight, there are three further elements you should consider:
- Risks: For instance, we've identified 1 warning sign for Black Knight that you should be aware of.
- Future Earnings: How does BKI's growth rate compare to its peers and the wider market? Dig deeper into the analyst consensus number for the upcoming years by interacting with our free analyst growth expectation chart.
- Other Solid Businesses: Low debt, high returns on equity and good past performance are fundamental to a strong business. Why not explore our interactive list of stocks with solid business fundamentals to see if there are other companies you may not have considered!
PS. The Simply Wall St app conducts a discounted cash flow valuation for every stock on the NYSE every day. If you want to find the calculation for other stocks just search here.
Valuation is complex, but we're here to simplify it.
Discover if Black Knight might be undervalued or overvalued with our detailed analysis, featuring fair value estimates, potential risks, dividends, insider trades, and its financial condition.
Access Free AnalysisHave feedback on this article? Concerned about the content? Get in touch with us directly. Alternatively, email editorial-team (at) simplywallst.com.
This article by Simply Wall St is general in nature. We provide commentary based on historical data and analyst forecasts only using an unbiased methodology and our articles are not intended to be financial advice. It does not constitute a recommendation to buy or sell any stock, and does not take account of your objectives, or your financial situation. We aim to bring you long-term focused analysis driven by fundamental data. Note that our analysis may not factor in the latest price-sensitive company announcements or qualitative material. Simply Wall St has no position in any stocks mentioned.
About NYSE:BKI
Black Knight
Black Knight, Inc. provides integrated software, data, and analytics solutions in North America and Internationally.
Imperfect balance sheet and overvalued.

