Advertisement
- United States
- /
- Software
- /
- NasdaqGS:VRNS
Varonis Systems, Inc.'s (NASDAQ:VRNS) Intrinsic Value Is Potentially 25% Below Its Share Price
Key Insights
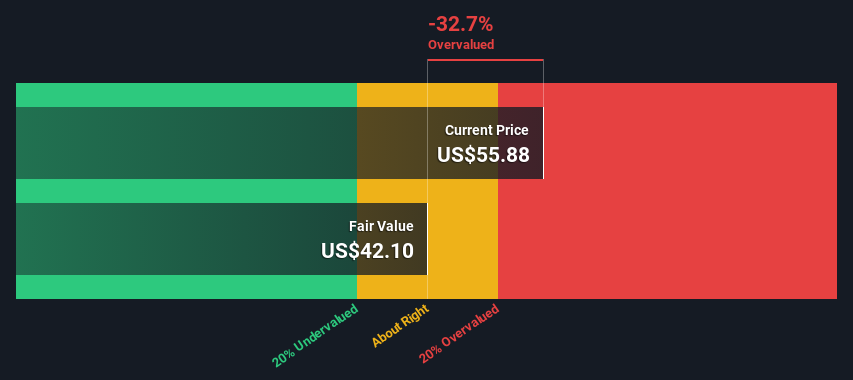
- Using the 2 Stage Free Cash Flow to Equity, Varonis Systems fair value estimate is US$42.10
- Varonis Systems' US$55.88 share price signals that it might be 33% overvalued
- Our fair value estimate is 26% lower than Varonis Systems' analyst price target of US$56.99
Today we will run through one way of estimating the intrinsic value of Varonis Systems, Inc. (NASDAQ:VRNS) by estimating the company's future cash flows and discounting them to their present value. We will use the Discounted Cash Flow (DCF) model on this occasion. Believe it or not, it's not too difficult to follow, as you'll see from our example!
We would caution that there are many ways of valuing a company and, like the DCF, each technique has advantages and disadvantages in certain scenarios. Anyone interested in learning a bit more about intrinsic value should have a read of the Simply Wall St analysis model.
See our latest analysis for Varonis Systems
Step By Step Through The Calculation
We are going to use a two-stage DCF model, which, as the name states, takes into account two stages of growth. The first stage is generally a higher growth period which levels off heading towards the terminal value, captured in the second 'steady growth' period. To begin with, we have to get estimates of the next ten years of cash flows. Where possible we use analyst estimates, but when these aren't available we extrapolate the previous free cash flow (FCF) from the last estimate or reported value. We assume companies with shrinking free cash flow will slow their rate of shrinkage, and that companies with growing free cash flow will see their growth rate slow, over this period. We do this to reflect that growth tends to slow more in the early years than it does in later years.
A DCF is all about the idea that a dollar in the future is less valuable than a dollar today, so we discount the value of these future cash flows to their estimated value in today's dollars:
10-year free cash flow (FCF) forecast
| 2025 | 2026 | 2027 | 2028 | 2029 | 2030 | 2031 | 2032 | 2033 | 2034 | |
| Levered FCF ($, Millions) | US$99.3m | US$138.2m | US$163.1m | US$185.0m | US$203.7m | US$219.6m | US$233.3m | US$245.2m | US$255.8m | US$265.5m |
| Growth Rate Estimate Source | Analyst x11 | Analyst x3 | Est @ 18.03% | Est @ 13.37% | Est @ 10.11% | Est @ 7.83% | Est @ 6.23% | Est @ 5.11% | Est @ 4.33% | Est @ 3.78% |
| Present Value ($, Millions) Discounted @ 6.7% | US$93.1 | US$121 | US$134 | US$143 | US$147 | US$149 | US$148 | US$146 | US$142 | US$138 |
("Est" = FCF growth rate estimated by Simply Wall St)
Present Value of 10-year Cash Flow (PVCF) = US$1.4b
The second stage is also known as Terminal Value, this is the business's cash flow after the first stage. For a number of reasons a very conservative growth rate is used that cannot exceed that of a country's GDP growth. In this case we have used the 5-year average of the 10-year government bond yield (2.5%) to estimate future growth. In the same way as with the 10-year 'growth' period, we discount future cash flows to today's value, using a cost of equity of 6.7%.
Terminal Value (TV)= FCF2034 × (1 + g) ÷ (r – g) = US$265m× (1 + 2.5%) ÷ (6.7%– 2.5%) = US$6.4b
Present Value of Terminal Value (PVTV)= TV / (1 + r)10= US$6.4b÷ ( 1 + 6.7%)10= US$3.4b
The total value, or equity value, is then the sum of the present value of the future cash flows, which in this case is US$4.7b. The last step is to then divide the equity value by the number of shares outstanding. Relative to the current share price of US$55.9, the company appears potentially overvalued at the time of writing. Valuations are imprecise instruments though, rather like a telescope - move a few degrees and end up in a different galaxy. Do keep this in mind.
The Assumptions
We would point out that the most important inputs to a discounted cash flow are the discount rate and of course the actual cash flows. If you don't agree with these result, have a go at the calculation yourself and play with the assumptions. The DCF also does not consider the possible cyclicality of an industry, or a company's future capital requirements, so it does not give a full picture of a company's potential performance. Given that we are looking at Varonis Systems as potential shareholders, the cost of equity is used as the discount rate, rather than the cost of capital (or weighted average cost of capital, WACC) which accounts for debt. In this calculation we've used 6.7%, which is based on a levered beta of 1.025. Beta is a measure of a stock's volatility, compared to the market as a whole. We get our beta from the industry average beta of globally comparable companies, with an imposed limit between 0.8 and 2.0, which is a reasonable range for a stable business.
SWOT Analysis for Varonis Systems
Strength
- Debt is not viewed as a risk.
Weakness
- Expensive based on P/S ratio and estimated fair value.
- Shareholders have been diluted in the past year.
Opportunity
- Has sufficient cash runway for more than 3 years based on current free cash flows.
Threat
- Not expected to become profitable over the next 3 years.
Next Steps:
Although the valuation of a company is important, it is only one of many factors that you need to assess for a company. The DCF model is not a perfect stock valuation tool. Preferably you'd apply different cases and assumptions and see how they would impact the company's valuation. For example, changes in the company's cost of equity or the risk free rate can significantly impact the valuation. Can we work out why the company is trading at a premium to intrinsic value? For Varonis Systems, we've put together three essential aspects you should further research:
- Risks: Consider for instance, the ever-present spectre of investment risk. We've identified 2 warning signs with Varonis Systems , and understanding them should be part of your investment process.
- Future Earnings: How does VRNS's growth rate compare to its peers and the wider market? Dig deeper into the analyst consensus number for the upcoming years by interacting with our free analyst growth expectation chart.
- Other Solid Businesses: Low debt, high returns on equity and good past performance are fundamental to a strong business. Why not explore our interactive list of stocks with solid business fundamentals to see if there are other companies you may not have considered!
PS. Simply Wall St updates its DCF calculation for every American stock every day, so if you want to find the intrinsic value of any other stock just search here.
New: Manage All Your Stock Portfolios in One Place
We've created the ultimate portfolio companion for stock investors, and it's free.
• Connect an unlimited number of Portfolios and see your total in one currency
• Be alerted to new Warning Signs or Risks via email or mobile
• Track the Fair Value of your stocks
Have feedback on this article? Concerned about the content? Get in touch with us directly. Alternatively, email editorial-team (at) simplywallst.com.
This article by Simply Wall St is general in nature. We provide commentary based on historical data and analyst forecasts only using an unbiased methodology and our articles are not intended to be financial advice. It does not constitute a recommendation to buy or sell any stock, and does not take account of your objectives, or your financial situation. We aim to bring you long-term focused analysis driven by fundamental data. Note that our analysis may not factor in the latest price-sensitive company announcements or qualitative material. Simply Wall St has no position in any stocks mentioned.
About NasdaqGS:VRNS
Varonis Systems
Provides software products and services that continuously discover and classify critical data, remediate exposures, and detect advanced threats with AI-powered technology in North America, Europe, APAC, and rest of worlds.
Excellent balance sheet and fair value.
Similar Companies
Market Insights


Advertisement
Weekly Picks
ST


stuart_roberts on Unicycive Therapeutics ·
Looking to be second time lucky with a game-changing new product
Fair Value:US$21.5362.1% undervalued
132 followersusers have followed this narrative
0 commentsusers have commented on this narrative
19 likesusers have liked this narrative
DE


Degen_GCR on Everpure ·
Second order memory play likely to double in a year
Fair Value:US$18053.7% undervalued
2 followersusers have followed this narrative
0 commentsusers have commented on this narrative
1 likeusers have liked this narrative
DO


Double_Bubbler on Intuitive Machines ·
Intuitive Machines: To The Moon and Beyond!
Fair Value:US$42.323.4% undervalued
4 followersusers have followed this narrative
0 commentsusers have commented on this narrative
1 likeusers have liked this narrative
YI

yiannisz on AppLovin ·
AppLovin’s AI Engine Is Printing Profit
Fair Value:US$989.2450.4% undervalued
21 followersusers have followed this narrative
1 commentusers have commented on this narrative
1 likeusers have liked this narrative
Recently Updated Narratives
OI

Oily on MV Oil Trust ·
Poor analysis here will mislead investors
Fair Value:US$2.11.0% undervalued
0 followersusers have followed this narrative
0 commentsusers have commented on this narrative
0 likesusers have liked this narrative
ZH


zhalia on Lynas Rare Earths ·
Lynas Rare Earths to Shine with 281% Future P/E Surge
Fair Value:AU$22.8714.7% undervalued
1 followerusers have followed this narrative
0 commentsusers have commented on this narrative
0 likesusers have liked this narrative
KA


kapirey on Roche Holding ·
Roche is a cash-generating, defensive large-cap pharma, with upside driven by pipeline execution.
Fair Value:CHF 353.349.0% undervalued
1 followerusers have followed this narrative
0 commentsusers have commented on this narrative
0 likesusers have liked this narrative
Popular Narratives
GO

GoldenSands on QuantumScape ·
QuantumScape: A Mispriced Deep‑Tech Inflection Point With Multi‑Billion‑Dollar Optionality
Fair Value:US$8590.1% undervalued
108 followersusers have followed this narrative
2 commentsusers have commented on this narrative
31 likesusers have liked this narrative
KI

Kingman1152 on NVIDIA ·
NVIDIA will see a profit margin surge of 55% in the next 5 years
Fair Value:US$305.227.7% undervalued
70 followersusers have followed this narrative
2 commentsusers have commented on this narrative
24 likesusers have liked this narrative
AN


AnalystConsensusTarget on Microsoft ·
Analyst Commentary Highlights Microsoft AI Momentum and Upward Valuation Amid Growth and Competitive Risks
Fair Value:US$561.9327.4% undervalued
1399 followersusers have followed this narrative
2 commentsusers have commented on this narrative
12 likesusers have liked this narrative
