Stock Analysis
- United States
- /
- Software
- /
- NasdaqGS:SPNS
Sapiens International (NASDAQ:SPNS) stock performs better than its underlying earnings growth over last five years


When you buy shares in a company, it's worth keeping in mind the possibility that it could fail, and you could lose your money. But on the bright side, if you buy shares in a high quality company at the right price, you can gain well over 100%. One great example is Sapiens International Corporation N.V. (NASDAQ:SPNS) which saw its share price drive 134% higher over five years. It's also up 15% in about a month. But the price may well have benefitted from a buoyant market, since stocks have gained 7.2% in the last thirty days.
Since it's been a strong week for Sapiens International shareholders, let's have a look at trend of the longer term fundamentals.
Check out our latest analysis for Sapiens International
To paraphrase Benjamin Graham: Over the short term the market is a voting machine, but over the long term it's a weighing machine. One flawed but reasonable way to assess how sentiment around a company has changed is to compare the earnings per share (EPS) with the share price.
Over half a decade, Sapiens International managed to grow its earnings per share at 30% a year. This EPS growth is higher than the 19% average annual increase in the share price. So it seems the market isn't so enthusiastic about the stock these days.
The company's earnings per share (over time) is depicted in the image below (click to see the exact numbers).
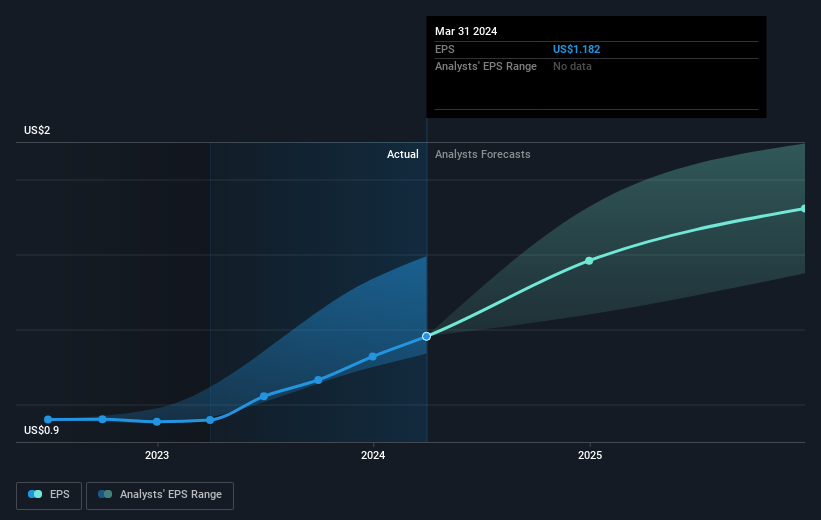
We know that Sapiens International has improved its bottom line lately, but is it going to grow revenue? This free report showing analyst revenue forecasts should help you figure out if the EPS growth can be sustained.
What About Dividends?
When looking at investment returns, it is important to consider the difference between total shareholder return (TSR) and share price return. The TSR is a return calculation that accounts for the value of cash dividends (assuming that any dividend received was reinvested) and the calculated value of any discounted capital raisings and spin-offs. So for companies that pay a generous dividend, the TSR is often a lot higher than the share price return. We note that for Sapiens International the TSR over the last 5 years was 156%, which is better than the share price return mentioned above. This is largely a result of its dividend payments!
A Different Perspective
We're pleased to report that Sapiens International shareholders have received a total shareholder return of 47% over one year. Of course, that includes the dividend. That gain is better than the annual TSR over five years, which is 21%. Therefore it seems like sentiment around the company has been positive lately. Someone with an optimistic perspective could view the recent improvement in TSR as indicating that the business itself is getting better with time. I find it very interesting to look at share price over the long term as a proxy for business performance. But to truly gain insight, we need to consider other information, too. Even so, be aware that Sapiens International is showing 1 warning sign in our investment analysis , you should know about...
Of course, you might find a fantastic investment by looking elsewhere. So take a peek at this free list of companies we expect will grow earnings.
Please note, the market returns quoted in this article reflect the market weighted average returns of stocks that currently trade on American exchanges.
Valuation is complex, but we're helping make it simple.
Find out whether Sapiens International is potentially over or undervalued by checking out our comprehensive analysis, which includes fair value estimates, risks and warnings, dividends, insider transactions and financial health.
View the Free AnalysisHave feedback on this article? Concerned about the content? Get in touch with us directly. Alternatively, email editorial-team (at) simplywallst.com.
This article by Simply Wall St is general in nature. We provide commentary based on historical data and analyst forecasts only using an unbiased methodology and our articles are not intended to be financial advice. It does not constitute a recommendation to buy or sell any stock, and does not take account of your objectives, or your financial situation. We aim to bring you long-term focused analysis driven by fundamental data. Note that our analysis may not factor in the latest price-sensitive company announcements or qualitative material. Simply Wall St has no position in any stocks mentioned.
About NasdaqGS:SPNS
Sapiens International
Provides software solutions for the insurance industry in North America, the United Kingdom, Europe, the Middle East, Africa, the Asia Pacific, and internationally.
Flawless balance sheet with solid track record.

