
Advertisement
- United States
- /
- Software
- /
- NasdaqGS:QLYS
Qualys, Inc.'s (NASDAQ:QLYS) Intrinsic Value Is Potentially 29% Above Its Share Price
Key Insights
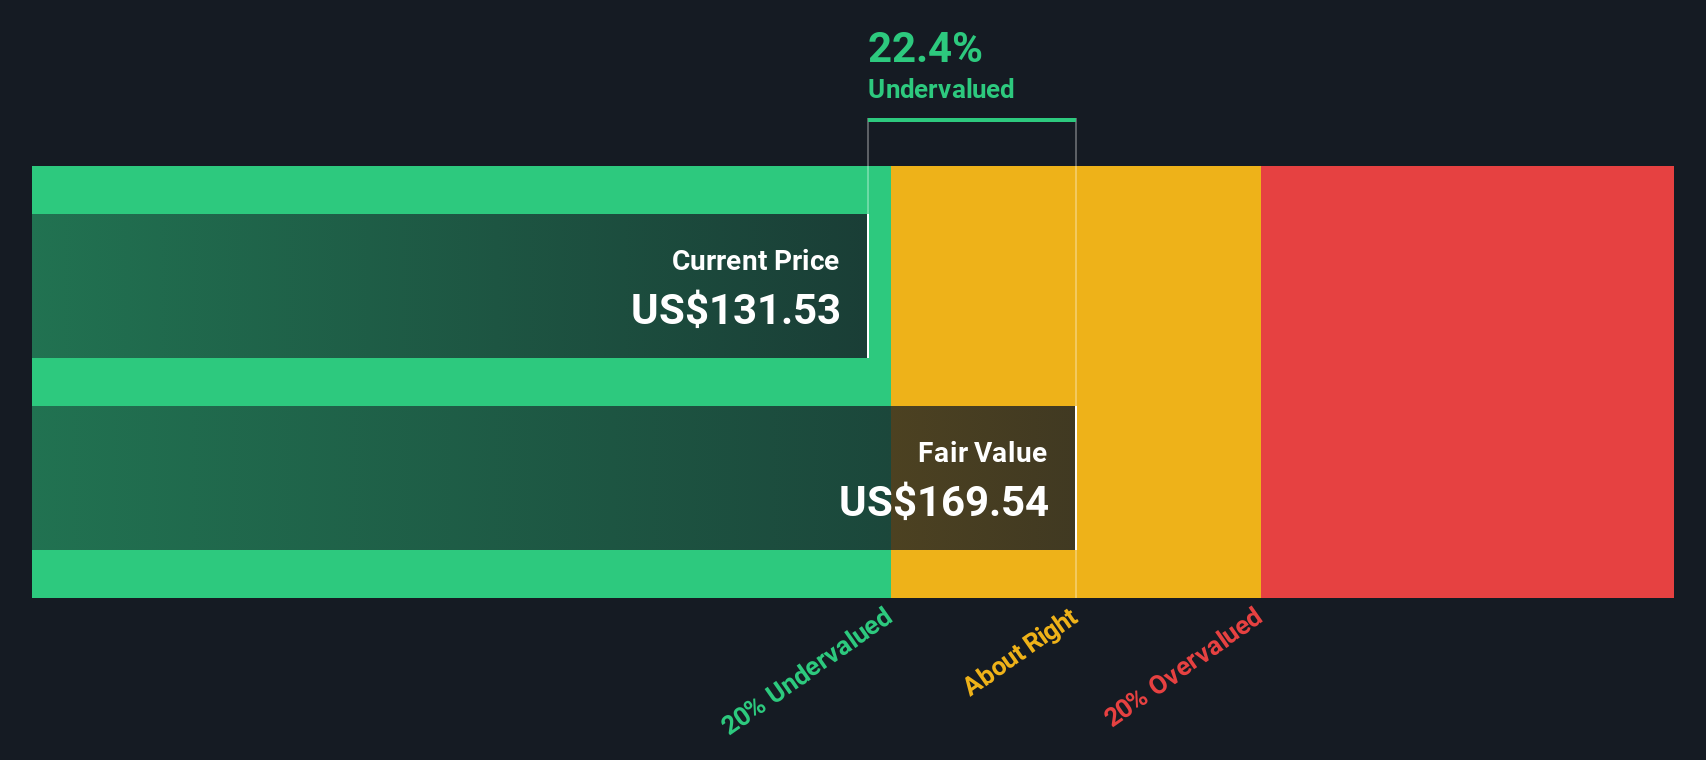
- Qualys' estimated fair value is US$170 based on 2 Stage Free Cash Flow to Equity
- Qualys is estimated to be 22% undervalued based on current share price of US$132
- Analyst price target for QLYS is US$141 which is 17% below our fair value estimate
How far off is Qualys, Inc. (NASDAQ:QLYS) from its intrinsic value? Using the most recent financial data, we'll take a look at whether the stock is fairly priced by taking the expected future cash flows and discounting them to today's value. Our analysis will employ the Discounted Cash Flow (DCF) model. Believe it or not, it's not too difficult to follow, as you'll see from our example!
Remember though, that there are many ways to estimate a company's value, and a DCF is just one method. Anyone interested in learning a bit more about intrinsic value should have a read of the Simply Wall St analysis model.
The Calculation
We use what is known as a 2-stage model, which simply means we have two different periods of growth rates for the company's cash flows. Generally the first stage is higher growth, and the second stage is a lower growth phase. In the first stage we need to estimate the cash flows to the business over the next ten years. Where possible we use analyst estimates, but when these aren't available we extrapolate the previous free cash flow (FCF) from the last estimate or reported value. We assume companies with shrinking free cash flow will slow their rate of shrinkage, and that companies with growing free cash flow will see their growth rate slow, over this period. We do this to reflect that growth tends to slow more in the early years than it does in later years.
A DCF is all about the idea that a dollar in the future is less valuable than a dollar today, so we need to discount the sum of these future cash flows to arrive at a present value estimate:
10-year free cash flow (FCF) forecast
| 2026 | 2027 | 2028 | 2029 | 2030 | 2031 | 2032 | 2033 | 2034 | 2035 | |
| Levered FCF ($, Millions) | US$254.4m | US$276.8m | US$305.1m | US$334.9m | US$358.0m | US$378.7m | US$397.5m | US$415.0m | US$431.6m | US$447.7m |
| Growth Rate Estimate Source | Analyst x15 | Analyst x8 | Analyst x2 | Analyst x2 | Est @ 6.93% | Est @ 5.77% | Est @ 4.96% | Est @ 4.40% | Est @ 4.00% | Est @ 3.73% |
| Present Value ($, Millions) Discounted @ 8.4% | US$235 | US$235 | US$239 | US$242 | US$239 | US$233 | US$226 | US$217 | US$208 | US$199 |
("Est" = FCF growth rate estimated by Simply Wall St)
Present Value of 10-year Cash Flow (PVCF) = US$2.3b
After calculating the present value of future cash flows in the initial 10-year period, we need to calculate the Terminal Value, which accounts for all future cash flows beyond the first stage. For a number of reasons a very conservative growth rate is used that cannot exceed that of a country's GDP growth. In this case we have used the 5-year average of the 10-year government bond yield (3.1%) to estimate future growth. In the same way as with the 10-year 'growth' period, we discount future cash flows to today's value, using a cost of equity of 8.4%.
Terminal Value (TV)= FCF2035 × (1 + g) ÷ (r – g) = US$448m× (1 + 3.1%) ÷ (8.4%– 3.1%) = US$8.6b
Present Value of Terminal Value (PVTV)= TV / (1 + r)10= US$8.6b÷ ( 1 + 8.4%)10= US$3.8b
The total value is the sum of cash flows for the next ten years plus the discounted terminal value, which results in the Total Equity Value, which in this case is US$6.1b. To get the intrinsic value per share, we divide this by the total number of shares outstanding. Compared to the current share price of US$132, the company appears a touch undervalued at a 22% discount to where the stock price trades currently. The assumptions in any calculation have a big impact on the valuation, so it is better to view this as a rough estimate, not precise down to the last cent.
Important Assumptions
The calculation above is very dependent on two assumptions. The first is the discount rate and the other is the cash flows. You don't have to agree with these inputs, I recommend redoing the calculations yourself and playing with them. The DCF also does not consider the possible cyclicality of an industry, or a company's future capital requirements, so it does not give a full picture of a company's potential performance. Given that we are looking at Qualys as potential shareholders, the cost of equity is used as the discount rate, rather than the cost of capital (or weighted average cost of capital, WACC) which accounts for debt. In this calculation we've used 8.4%, which is based on a levered beta of 1.157. Beta is a measure of a stock's volatility, compared to the market as a whole. We get our beta from the industry average beta of globally comparable companies, with an imposed limit between 0.8 and 2.0, which is a reasonable range for a stable business.
Check out our latest analysis for Qualys
SWOT Analysis for Qualys
Strength
- Currently debt free.
Weakness
- Earnings growth over the past year underperformed the Software industry.
Opportunity
- Annual earnings are forecast to grow for the next 3 years.
- Good value based on P/E ratio and estimated fair value.
Threat
- Annual earnings are forecast to grow slower than the American market.
Next Steps:
Although the valuation of a company is important, it ideally won't be the sole piece of analysis you scrutinize for a company. It's not possible to obtain a foolproof valuation with a DCF model. Preferably you'd apply different cases and assumptions and see how they would impact the company's valuation. If a company grows at a different rate, or if its cost of equity or risk free rate changes sharply, the output can look very different. Why is the intrinsic value higher than the current share price? For Qualys, we've put together three important aspects you should explore:
- Risks: To that end, you should be aware of the 1 warning sign we've spotted with Qualys .
- Management:Have insiders been ramping up their shares to take advantage of the market's sentiment for QLYS's future outlook? Check out our management and board analysis with insights on CEO compensation and governance factors.
- Other Solid Businesses: Low debt, high returns on equity and good past performance are fundamental to a strong business. Why not explore our interactive list of stocks with solid business fundamentals to see if there are other companies you may not have considered!
PS. The Simply Wall St app conducts a discounted cash flow valuation for every stock on the NASDAQGS every day. If you want to find the calculation for other stocks just search here.
Valuation is complex, but we're here to simplify it.
Discover if Qualys might be undervalued or overvalued with our detailed analysis, featuring fair value estimates, potential risks, dividends, insider trades, and its financial condition.
Access Free AnalysisHave feedback on this article? Concerned about the content? Get in touch with us directly. Alternatively, email editorial-team (at) simplywallst.com.
This article by Simply Wall St is general in nature. We provide commentary based on historical data and analyst forecasts only using an unbiased methodology and our articles are not intended to be financial advice. It does not constitute a recommendation to buy or sell any stock, and does not take account of your objectives, or your financial situation. We aim to bring you long-term focused analysis driven by fundamental data. Note that our analysis may not factor in the latest price-sensitive company announcements or qualitative material. Simply Wall St has no position in any stocks mentioned.
About NasdaqGS:QLYS
Qualys
Provides cloud-based platform delivering information technology (IT), security, and compliance solutions in the United States and internationally.
Flawless balance sheet with proven track record.
Similar Companies
Market Insights

Advertisement
Weekly Picks
FA

FAI on Arabian Internet and Communication Services ·
Solutions by stc: 34% Upside in Saudi's Digital Transformation Leader
Fair Value:ر.س342.2335.5% undervalued
10 followersusers have followed this narrative
1 commentusers have commented on this narrative
4 likesusers have liked this narrative
RO


RobertoAllende on NVIDIA ·
The AI Infrastructure Giant Grows Into Its Valuation
Fair Value:US$345.0747.9% undervalued
28 followersusers have followed this narrative
28 commentsusers have commented on this narrative
21 likesusers have liked this narrative
Recently Updated Narratives
TA

Talos on NVIDIA ·
Not a Bubble, But the "Industrial Revolution 4.0" Engine
Fair Value:US$294.9239.0% undervalued
1 followerusers have followed this narrative
0 commentsusers have commented on this narrative
0 likesusers have liked this narrative
TA

Talos on Advanced Micro Devices ·
The "David vs. Goliath" AI Trade – Why Second Place is Worth Billions
Fair Value:US$416.4647.2% undervalued
2 followersusers have followed this narrative
0 commentsusers have commented on this narrative
0 likesusers have liked this narrative
TA

Talos on PayPal Holdings ·
The "Sleeping Giant" Wakes Up – Efficiency & Monetization
Fair Value:US$174.9264.2% undervalued
4 followersusers have followed this narrative
0 commentsusers have commented on this narrative
0 likesusers have liked this narrative
Popular Narratives
TH


TheWallstreetKing on MicroVision ·
MicroVision will explode future revenue by 380.37% with a vision towards success
Fair Value:US$6098.6% undervalued
111 followersusers have followed this narrative
11 commentsusers have commented on this narrative
22 likesusers have liked this narrative
AN

AnalystConsensusTarget on NVIDIA ·
NVDA: Expanding AI Demand Will Drive Major Data Center Investments Through 2026
Fair Value:US$250.3928.1% undervalued
945 followersusers have followed this narrative
6 commentsusers have commented on this narrative
24 likesusers have liked this narrative
OS


oscargarcia on Alphabet ·
The company that turned a verb into a global necessity and basically runs the modern internet, digital ads, smartphones, maps, and AI.
Fair Value:US$3407.4% undervalued
146 followersusers have followed this narrative
6 commentsusers have commented on this narrative
18 likesusers have liked this narrative