- United States
- /
- Software
- /
- NasdaqGS:MSFT
Microsoft (NASDAQ:MSFT) shareholders have earned a 25% CAGR over the last five years


Microsoft Corporation (NASDAQ:MSFT) shareholders might be concerned after seeing the share price drop 10% in the last month. But that scarcely detracts from the really solid long term returns generated by the company over five years. In fact, the share price is 194% higher today. We think it's more important to dwell on the long term returns than the short term returns. Of course, that doesn't necessarily mean it's cheap now.
Now it's worth having a look at the company's fundamentals too, because that will help us determine if the long term shareholder return has matched the performance of the underlying business.
See our latest analysis for Microsoft
To paraphrase Benjamin Graham: Over the short term the market is a voting machine, but over the long term it's a weighing machine. By comparing earnings per share (EPS) and share price changes over time, we can get a feel for how investor attitudes to a company have morphed over time.
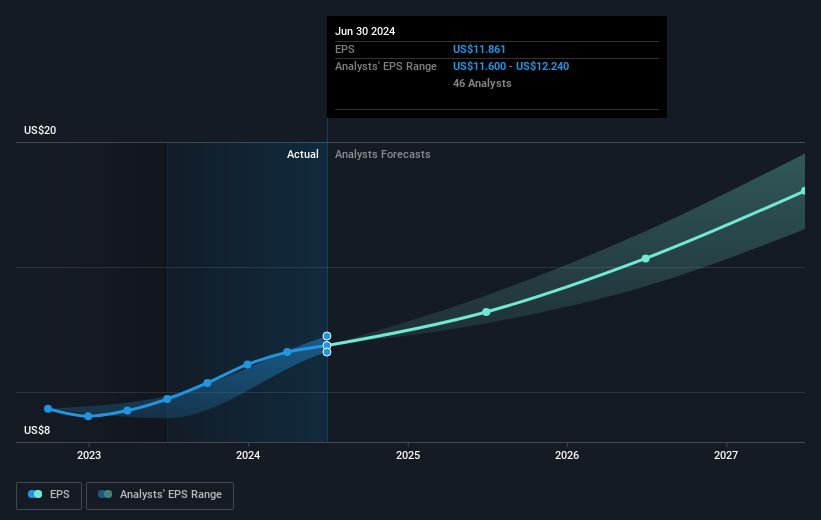
During five years of share price growth, Microsoft achieved compound earnings per share (EPS) growth of 18% per year. This EPS growth is slower than the share price growth of 24% per year, over the same period. So it's fair to assume the market has a higher opinion of the business than it did five years ago. And that's hardly shocking given the track record of growth.
You can see below how EPS has changed over time (discover the exact values by clicking on the image).
We know that Microsoft has improved its bottom line lately, but is it going to grow revenue? Check if analysts think Microsoft will grow revenue in the future.
What About Dividends?
When looking at investment returns, it is important to consider the difference between total shareholder return (TSR) and share price return. Whereas the share price return only reflects the change in the share price, the TSR includes the value of dividends (assuming they were reinvested) and the benefit of any discounted capital raising or spin-off. Arguably, the TSR gives a more comprehensive picture of the return generated by a stock. In the case of Microsoft, it has a TSR of 207% for the last 5 years. That exceeds its share price return that we previously mentioned. This is largely a result of its dividend payments!
A Different Perspective
It's good to see that Microsoft has rewarded shareholders with a total shareholder return of 27% in the last twelve months. Of course, that includes the dividend. That gain is better than the annual TSR over five years, which is 25%. Therefore it seems like sentiment around the company has been positive lately. Given the share price momentum remains strong, it might be worth taking a closer look at the stock, lest you miss an opportunity. It's always interesting to track share price performance over the longer term. But to understand Microsoft better, we need to consider many other factors. Consider risks, for instance. Every company has them, and we've spotted 1 warning sign for Microsoft you should know about.
If you like to buy stocks alongside management, then you might just love this free list of companies. (Hint: many of them are unnoticed AND have attractive valuation).
Please note, the market returns quoted in this article reflect the market weighted average returns of stocks that currently trade on American exchanges.
New: Manage All Your Stock Portfolios in One Place
We've created the ultimate portfolio companion for stock investors, and it's free.
• Connect an unlimited number of Portfolios and see your total in one currency
• Be alerted to new Warning Signs or Risks via email or mobile
• Track the Fair Value of your stocks
Have feedback on this article? Concerned about the content? Get in touch with us directly. Alternatively, email editorial-team (at) simplywallst.com.
This article by Simply Wall St is general in nature. We provide commentary based on historical data and analyst forecasts only using an unbiased methodology and our articles are not intended to be financial advice. It does not constitute a recommendation to buy or sell any stock, and does not take account of your objectives, or your financial situation. We aim to bring you long-term focused analysis driven by fundamental data. Note that our analysis may not factor in the latest price-sensitive company announcements or qualitative material. Simply Wall St has no position in any stocks mentioned.
About NasdaqGS:MSFT
Microsoft
Develops and supports software, services, devices and solutions worldwide.
Flawless balance sheet and undervalued.
