- United States
- /
- IT
- /
- NasdaqGS:HCKT
Here's Why Hackett Group (NASDAQ:HCKT) Can Manage Its Debt Responsibly

Warren Buffett famously said, 'Volatility is far from synonymous with risk.' So it seems the smart money knows that debt - which is usually involved in bankruptcies - is a very important factor, when you assess how risky a company is. As with many other companies The Hackett Group, Inc. (NASDAQ:HCKT) makes use of debt. But should shareholders be worried about its use of debt?
When Is Debt A Problem?
Debt and other liabilities become risky for a business when it cannot easily fulfill those obligations, either with free cash flow or by raising capital at an attractive price. If things get really bad, the lenders can take control of the business. However, a more frequent (but still costly) occurrence is where a company must issue shares at bargain-basement prices, permanently diluting shareholders, just to shore up its balance sheet. Of course, debt can be an important tool in businesses, particularly capital heavy businesses. When we think about a company's use of debt, we first look at cash and debt together.
Check out our latest analysis for Hackett Group
What Is Hackett Group's Debt?
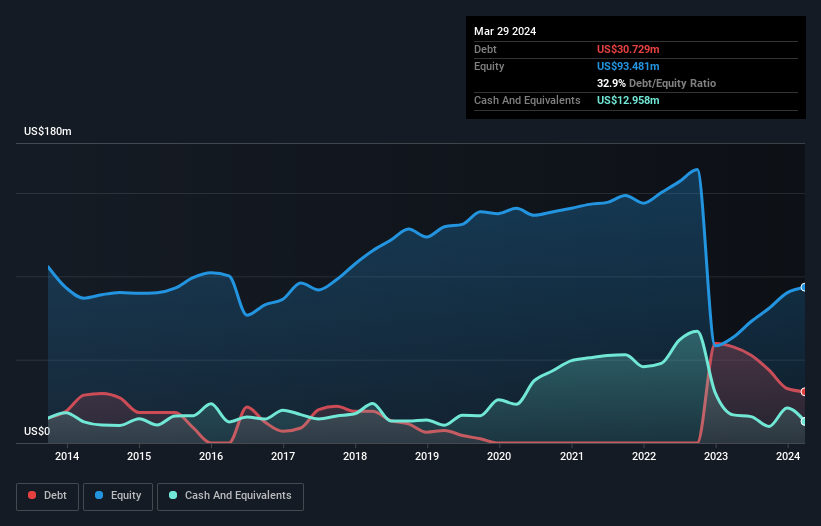
The image below, which you can click on for greater detail, shows that Hackett Group had debt of US$30.7m at the end of March 2024, a reduction from US$57.7m over a year. However, it does have US$13.0m in cash offsetting this, leading to net debt of about US$17.8m.
How Strong Is Hackett Group's Balance Sheet?
Zooming in on the latest balance sheet data, we can see that Hackett Group had liabilities of US$44.3m due within 12 months and liabilities of US$41.5m due beyond that. Offsetting these obligations, it had cash of US$13.0m as well as receivables valued at US$58.0m due within 12 months. So its liabilities outweigh the sum of its cash and (near-term) receivables by US$14.9m.
Of course, Hackett Group has a market capitalization of US$633.5m, so these liabilities are probably manageable. Having said that, it's clear that we should continue to monitor its balance sheet, lest it change for the worse.
In order to size up a company's debt relative to its earnings, we calculate its net debt divided by its earnings before interest, tax, depreciation, and amortization (EBITDA) and its earnings before interest and tax (EBIT) divided by its interest expense (its interest cover). This way, we consider both the absolute quantum of the debt, as well as the interest rates paid on it.
Hackett Group has a low net debt to EBITDA ratio of only 0.30. And its EBIT easily covers its interest expense, being 19.7 times the size. So we're pretty relaxed about its super-conservative use of debt. While Hackett Group doesn't seem to have gained much on the EBIT line, at least earnings remain stable for now. When analysing debt levels, the balance sheet is the obvious place to start. But it is future earnings, more than anything, that will determine Hackett Group's ability to maintain a healthy balance sheet going forward. So if you want to see what the professionals think, you might find this free report on analyst profit forecasts to be interesting.
Finally, a business needs free cash flow to pay off debt; accounting profits just don't cut it. So we clearly need to look at whether that EBIT is leading to corresponding free cash flow. Over the most recent three years, Hackett Group recorded free cash flow worth 77% of its EBIT, which is around normal, given free cash flow excludes interest and tax. This cold hard cash means it can reduce its debt when it wants to.
Our View
The good news is that Hackett Group's demonstrated ability to cover its interest expense with its EBIT delights us like a fluffy puppy does a toddler. And the good news does not stop there, as its conversion of EBIT to free cash flow also supports that impression! Zooming out, Hackett Group seems to use debt quite reasonably; and that gets the nod from us. After all, sensible leverage can boost returns on equity. Over time, share prices tend to follow earnings per share, so if you're interested in Hackett Group, you may well want to click here to check an interactive graph of its earnings per share history.
Of course, if you're the type of investor who prefers buying stocks without the burden of debt, then don't hesitate to discover our exclusive list of net cash growth stocks, today.
The New Payments ETF Is Live on NASDAQ:
Money is moving to real-time rails, and a newly listed ETF now gives investors direct exposure. Fast settlement. Institutional custody. Simple access.
Explore how this launch could reshape portfolios
Sponsored ContentValuation is complex, but we're here to simplify it.
Discover if Hackett Group might be undervalued or overvalued with our detailed analysis, featuring fair value estimates, potential risks, dividends, insider trades, and its financial condition.
Access Free AnalysisHave feedback on this article? Concerned about the content? Get in touch with us directly. Alternatively, email editorial-team (at) simplywallst.com.
This article by Simply Wall St is general in nature. We provide commentary based on historical data and analyst forecasts only using an unbiased methodology and our articles are not intended to be financial advice. It does not constitute a recommendation to buy or sell any stock, and does not take account of your objectives, or your financial situation. We aim to bring you long-term focused analysis driven by fundamental data. Note that our analysis may not factor in the latest price-sensitive company announcements or qualitative material. Simply Wall St has no position in any stocks mentioned.
Have feedback on this article? Concerned about the content? Get in touch with us directly. Alternatively, email editorial-team@simplywallst.com
About NasdaqGS:HCKT
Hackett Group
Operates as an intellectual property platform-based generative artificial intelligence strategic consulting and executive advisory digital transformation in the United States, Europe, and internationally.
Excellent balance sheet, good value and pays a dividend.
Similar Companies
Market Insights

Weekly Picks

Early mover in a fast growing industry. Likely to experience share price volatility as they scale


A case for CA$31.80 (undiluted), aka 8,616% upside from CA$0.37 (an 86 bagger!).


Moderation and Stabilisation: HOLD: Fair Price based on a 4-year Cycle is $12.08
Recently Updated Narratives


Title: Market Sentiment Is Dead Wrong — Here's Why PSEC Deserves a Second Look


An amazing opportunity to potentially get a 100 bagger

Amazon: Why the World’s Biggest Platform Still Runs on Invisible Economics
Popular Narratives


Crazy Undervalued 42 Baggers Silver Play (Active & Running Mine)


MicroVision will explode future revenue by 380.37% with a vision towards success


NVDA: Expanding AI Demand Will Drive Major Data Center Investments Through 2026
Trending Discussion
