
Advertisement
- United States
- /
- IT
- /
- NasdaqGS:HCKT
An Intrinsic Calculation For The Hackett Group, Inc. (NASDAQ:HCKT) Suggests It's 26% Undervalued
Key Insights
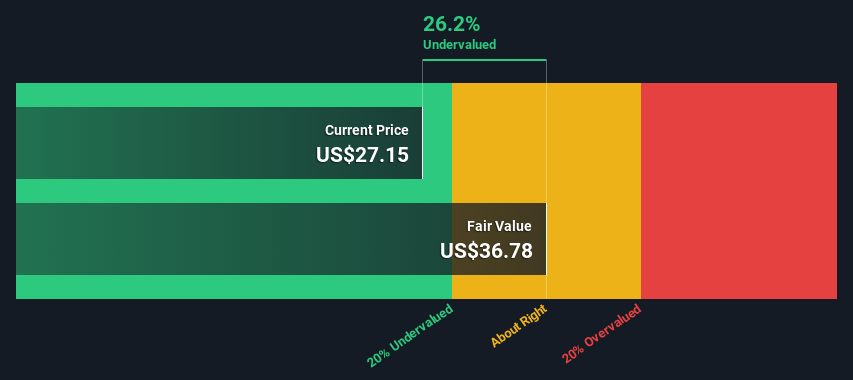
- The projected fair value for Hackett Group is US$36.78 based on 2 Stage Free Cash Flow to Equity
- Current share price of US$27.15 suggests Hackett Group is potentially 26% undervalued
- Hackett Group's peers seem to be trading at a lower discount to fair value based on the industry average of 20%
Today we'll do a simple run through of a valuation method used to estimate the attractiveness of The Hackett Group, Inc. (NASDAQ:HCKT) as an investment opportunity by taking the expected future cash flows and discounting them to today's value. We will use the Discounted Cash Flow (DCF) model on this occasion. Don't get put off by the jargon, the math behind it is actually quite straightforward.
Companies can be valued in a lot of ways, so we would point out that a DCF is not perfect for every situation. If you still have some burning questions about this type of valuation, take a look at the Simply Wall St analysis model.
The Model
We're using the 2-stage growth model, which simply means we take in account two stages of company's growth. In the initial period the company may have a higher growth rate and the second stage is usually assumed to have a stable growth rate. To start off with, we need to estimate the next ten years of cash flows. Where possible we use analyst estimates, but when these aren't available we extrapolate the previous free cash flow (FCF) from the last estimate or reported value. We assume companies with shrinking free cash flow will slow their rate of shrinkage, and that companies with growing free cash flow will see their growth rate slow, over this period. We do this to reflect that growth tends to slow more in the early years than it does in later years.
Generally we assume that a dollar today is more valuable than a dollar in the future, and so the sum of these future cash flows is then discounted to today's value:
10-year free cash flow (FCF) estimate
| 2025 | 2026 | 2027 | 2028 | 2029 | 2030 | 2031 | 2032 | 2033 | 2034 | |
| Levered FCF ($, Millions) | US$57.0m | US$56.4m | US$56.5m | US$57.0m | US$57.9m | US$58.9m | US$60.2m | US$61.6m | US$63.1m | US$64.7m |
| Growth Rate Estimate Source | Analyst x1 | Analyst x1 | Est @ 0.15% | Est @ 0.93% | Est @ 1.48% | Est @ 1.86% | Est @ 2.13% | Est @ 2.31% | Est @ 2.44% | Est @ 2.54% |
| Present Value ($, Millions) Discounted @ 7.8% | US$52.9 | US$48.6 | US$45.1 | US$42.2 | US$39.8 | US$37.6 | US$35.6 | US$33.8 | US$32.1 | US$30.6 |
("Est" = FCF growth rate estimated by Simply Wall St)
Present Value of 10-year Cash Flow (PVCF) = US$398m
We now need to calculate the Terminal Value, which accounts for all the future cash flows after this ten year period. The Gordon Growth formula is used to calculate Terminal Value at a future annual growth rate equal to the 5-year average of the 10-year government bond yield of 2.8%. We discount the terminal cash flows to today's value at a cost of equity of 7.8%.
Terminal Value (TV)= FCF2034 × (1 + g) ÷ (r – g) = US$65m× (1 + 2.8%) ÷ (7.8%– 2.8%) = US$1.3b
Present Value of Terminal Value (PVTV)= TV / (1 + r)10= US$1.3b÷ ( 1 + 7.8%)10= US$624m
The total value is the sum of cash flows for the next ten years plus the discounted terminal value, which results in the Total Equity Value, which in this case is US$1.0b. In the final step we divide the equity value by the number of shares outstanding. Relative to the current share price of US$27.2, the company appears a touch undervalued at a 26% discount to where the stock price trades currently. Remember though, that this is just an approximate valuation, and like any complex formula - garbage in, garbage out.
Important Assumptions
The calculation above is very dependent on two assumptions. The first is the discount rate and the other is the cash flows. You don't have to agree with these inputs, I recommend redoing the calculations yourself and playing with them. The DCF also does not consider the possible cyclicality of an industry, or a company's future capital requirements, so it does not give a full picture of a company's potential performance. Given that we are looking at Hackett Group as potential shareholders, the cost of equity is used as the discount rate, rather than the cost of capital (or weighted average cost of capital, WACC) which accounts for debt. In this calculation we've used 7.8%, which is based on a levered beta of 1.163. Beta is a measure of a stock's volatility, compared to the market as a whole. We get our beta from the industry average beta of globally comparable companies, with an imposed limit between 0.8 and 2.0, which is a reasonable range for a stable business.
Check out our latest analysis for Hackett Group
SWOT Analysis for Hackett Group
Strength
- Debt is not viewed as a risk.
- Dividends are covered by earnings and cash flows.
Weakness
- Earnings declined over the past year.
- Dividend is low compared to the top 25% of dividend payers in the IT market.
Opportunity
- Annual earnings are forecast to grow faster than the American market.
- Good value based on P/E ratio and estimated fair value.
Threat
- No apparent threats visible for HCKT.
Looking Ahead:
Whilst important, the DCF calculation ideally won't be the sole piece of analysis you scrutinize for a company. It's not possible to obtain a foolproof valuation with a DCF model. Rather it should be seen as a guide to "what assumptions need to be true for this stock to be under/overvalued?" If a company grows at a different rate, or if its cost of equity or risk free rate changes sharply, the output can look very different. Can we work out why the company is trading at a discount to intrinsic value? For Hackett Group, there are three fundamental factors you should look at:
- Financial Health: Does HCKT have a healthy balance sheet? Take a look at our free balance sheet analysis with six simple checks on key factors like leverage and risk.
- Future Earnings: How does HCKT's growth rate compare to its peers and the wider market? Dig deeper into the analyst consensus number for the upcoming years by interacting with our free analyst growth expectation chart .
- Other High Quality Alternatives: Do you like a good all-rounder? Explore our interactive list of high quality stocks to get an idea of what else is out there you may be missing!
PS. Simply Wall St updates its DCF calculation for every American stock every day, so if you want to find the intrinsic value of any other stock just search here.
Valuation is complex, but we're here to simplify it.
Discover if Hackett Group might be undervalued or overvalued with our detailed analysis, featuring fair value estimates, potential risks, dividends, insider trades, and its financial condition.
Access Free AnalysisHave feedback on this article? Concerned about the content? Get in touch with us directly. Alternatively, email editorial-team (at) simplywallst.com.
This article by Simply Wall St is general in nature. We provide commentary based on historical data and analyst forecasts only using an unbiased methodology and our articles are not intended to be financial advice. It does not constitute a recommendation to buy or sell any stock, and does not take account of your objectives, or your financial situation. We aim to bring you long-term focused analysis driven by fundamental data. Note that our analysis may not factor in the latest price-sensitive company announcements or qualitative material. Simply Wall St has no position in any stocks mentioned.
MI

The Foxhole
Apple's near record highs, yet the AI crowd still writes it off as a laggard. I think they're misreading the strategy.

1110
AR

artoflosing
Apple now is a hedge for hyperscalers.
JA

Jake_Merritt
In that case Google is better placed. It owns both the model and the massive distribution.
 Mitchell Lawler
Market Insights
Which payment stocks actually get paid?

Every new payment app was supposed to kill Visa and Mastercard. Instead, they got bigger. So what does that mean for the payment stocks on your radar?
32
About NasdaqGS:HCKT
Hackett Group
Operates as an intellectual property platform-based generative artificial intelligence strategic consulting and executive advisory digital transformation in the United States, Europe, and internationally.
Very undervalued 6 star dividend payer.
Similar Companies
Market Insights


Advertisement
Weekly Picks
RI


Rick_Orford on Starfighters Space ·
The 1960s Fighter Jet That Could Crack Open a $20 Billion Satellite Market
Fair Value:US$522.0% undervalued
63 followersusers have followed this narrative
4 commentsusers have commented on this narrative
11 likesusers have liked this narrative
JO


John_Eric on MercadoLibre ·
MercadoLibre and the Spreadsheet Trick That Decides Everything
Fair Value:US$7.31k73.7% undervalued
116 followersusers have followed this narrative
3 commentsusers have commented on this narrative
17 likesusers have liked this narrative
RC

rcb9 on PayPal Holdings ·
Ten Percent More Volume, One Percent More Transaction Margin
Fair Value:US$70.8913.2% undervalued
18 followersusers have followed this narrative
1 commentusers have commented on this narrative
6 likesusers have liked this narrative
HE


HedgeY on Micron Technology ·
Micron - The Memory Bottleneck Behind the AI Supercycle
Fair Value:US$1.25k22.7% undervalued
48 followersusers have followed this narrative
0 commentsusers have commented on this narrative
17 likesusers have liked this narrative
Recently Updated Narratives
BA

Baranclever on Rheinmetall ·
Rheinmetall AG: 2029 Valuation Outlook — €2,900–€6,800 per Share
Fair Value:€5.87k80.8% undervalued
1 followerusers have followed this narrative
0 commentsusers have commented on this narrative
0 likesusers have liked this narrative
BE

Beastor on Alvopetro Energy ·
Alvopetro Energy - Good Dividend but limited upside potential at price around $10
Fair Value:CA$10.151.7% undervalued
1 followerusers have followed this narrative
0 commentsusers have commented on this narrative
0 likesusers have liked this narrative
TR


TripleS on Harte Hanks ·
Star Equity (STRR) is buying Harte-Hanks (HHS) at $5.00 a share, half in cash and half in a 10% cumulative preferred (STRRP). HHS trades at
Fair Value:US$4.9525.7% undervalued
1 followerusers have followed this narrative
0 commentsusers have commented on this narrative
0 likesusers have liked this narrative
Popular Narratives
OS


oscargarcia on NVIDIA ·
The company that went from selling GPUs to gamers to becoming the AI arms dealer of the 21st century.
Fair Value:US$28023.3% undervalued
345 followersusers have followed this narrative
9 commentsusers have commented on this narrative
16 likesusers have liked this narrative
CU

CubanEros on Microsoft ·
A wonderful business at reasonable price.
Fair Value:US$419.9115.1% overvalued
194 followersusers have followed this narrative
0 commentsusers have commented on this narrative
9 likesusers have liked this narrative
KI

KiwiInvest on Amazon.com ·
Amazon's high growth, high tech segments propel its profits, while traditional segments plod along
Fair Value:US$475.0945.6% undervalued
222 followersusers have followed this narrative
1 commentusers have commented on this narrative
8 likesusers have liked this narrative
Trending Discussion


JO
johnk72 on Global X AI Infrastructure ETF ·
Great picks & shovels investment. I hold 3,000 units with a plan to hold until the end of 2028
2
|0