Advertisement
- United States
- /
- Software
- /
- NasdaqGS:APP
Assessing AppLovin's Value After Its 86.5% 2025 Rally and AI Tech Partnerships

Simply Wall St
Reviewed by Bailey Pemberton
- Wondering if AppLovin's meteoric stock rise means it's still a bargain, or if all the value is already priced in? You're not alone, and you're in the right place to dig deeper.
- AppLovin has turned heads this year with an 86.5% gain year-to-date and an eye-popping 289.7% return over the past 12 months, while still experiencing some recent volatility, such as a -9.5% dip in the last month.
- AppLovin’s recent run has been fueled by positive sentiment following several high-profile partnerships and ongoing optimism around its AI-driven ad tech platform. These developments have sparked both excitement about growth potential and debate over whether investor enthusiasm has run ahead of fundamentals.
- On our valuation checks, AppLovin scored 0 out of 6 for being undervalued, which invites a closer look at both traditional and alternative ways to assess its true worth. Stick around, because we'll explore a smarter approach to valuation before we wrap up.
AppLovin scores just 0/6 on our valuation checks. See what other red flags we found in the full valuation breakdown.
Approach 1: AppLovin Discounted Cash Flow (DCF) Analysis
The Discounted Cash Flow (DCF) model estimates a company's intrinsic value by projecting its future cash flows and then discounting those amounts back to today's value. The goal is to reflect the present worth of the business based on anticipated performance.
For AppLovin, the DCF analysis starts with current Free Cash Flow (FCF) of $2.89 billion. Analyst projections set the company’s FCF at $8.84 billion by 2029, while interim projections indicate strong annual increases. It is important to note that although analyst estimates typically cover only the next five years, projections for years beyond that are based on in-house extrapolations. This includes an expected FCF of $13.89 billion in 2035.
After discounting these future cash flows, the DCF approach computes an intrinsic value per share of $530.17. This is approximately 20.2% below the recent share price, suggesting AppLovin trades significantly above its estimated fair value according to these cash flow models.
Result: OVERVALUED
Our Discounted Cash Flow (DCF) analysis suggests AppLovin may be overvalued by 20.2%. Discover 832 undervalued stocks or create your own screener to find better value opportunities.
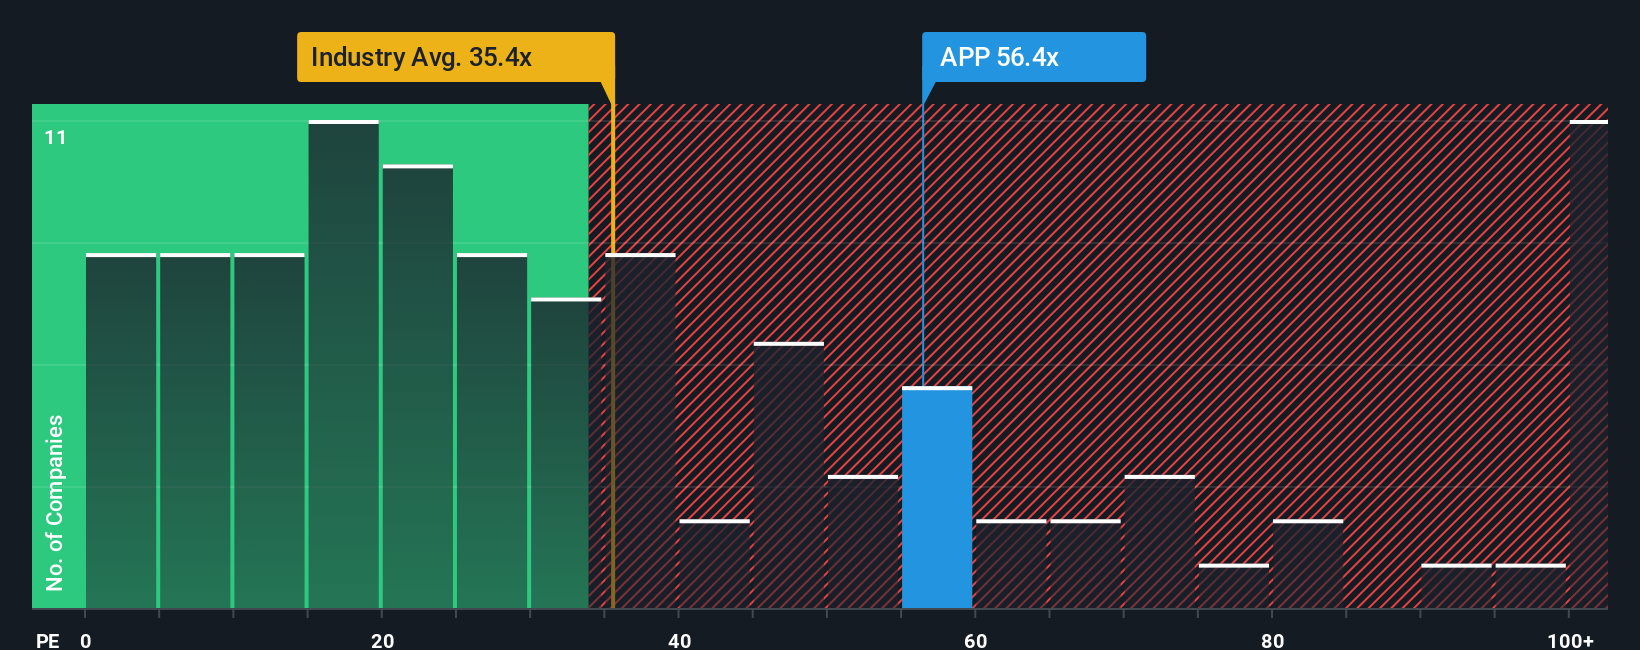
Approach 2: AppLovin Price vs Earnings
The price-to-earnings (PE) ratio is a go-to metric for valuing profitable businesses because it shows how much investors are willing to pay today for each dollar of current earnings. Companies with strong profits and consistent earnings growth typically command higher PE ratios, while riskier or slow-growing companies usually trade at lower multiples.
A "normal" or fair PE ratio is heavily influenced by expectations of future growth and perceived risk. Higher anticipated earnings growth often justifies a higher PE, while increased risks such as market competition or regulatory headwinds usually pull it downward. Context, such as industry standards and peer performance, also matters when judging whether a company's PE is justified.
Right now, AppLovin is trading on a PE ratio of 85.77x. To put that in perspective, the industry average sits at 34.72x, and the average of similar peers is 48.17x. This means AppLovin is priced far above both its industry and most comparable companies. However, Simply Wall St’s proprietary Fair Ratio, designed to better reflect AppLovin’s unique mix of growth, profit margins, market cap and sector characteristics, lands precisely at 58.36x. Unlike static peer or industry comparisons, the Fair Ratio offers deeper context by factoring in everything from profit quality to risk profile, making it a smarter benchmark for today's dynamic companies.
Given AppLovin’s current PE of 85.77x versus its Fair Ratio of 58.36x, the stock looks considerably more expensive than what would typically be warranted, even taking its growth into account.
Result: OVERVALUED
PE ratios tell one story, but what if the real opportunity lies elsewhere? Discover 1410 companies where insiders are betting big on explosive growth.
Upgrade Your Decision Making: Choose your AppLovin Narrative
Earlier we mentioned that there's an even better way to understand valuation. Let's introduce you to Narratives. A Narrative is your unique, data-backed story about a company, connecting how you see its future revenue, earnings, margins, and fair value to current events and catalysts. In other words, Narratives let you bring together all the facts, forecasts, and risks to clearly explain the "why" behind your valuation. This turns numbers into a living, evolving investment thesis.
Available on Simply Wall St’s Community page, Narratives are designed for everyone and help you confidently decide whether to buy or sell by directly comparing each Narrative’s Fair Value with the latest share price. Best of all, Narratives update automatically whenever key news or results arrive, so your investment perspective stays fresh and relevant.
For example, some AppLovin investors believe international expansion, e-commerce diversification, and ongoing technology upgrades will drive the company’s fair value as high as $650, while more cautious voices see regulatory risks and platform dependency driving fair value closer to $250. Narratives help you examine both sides and make a decision based on your perspective, putting transparent, actionable insight at your fingertips.
Do you think there's more to the story for AppLovin? Head over to our Community to see what others are saying!
This article by Simply Wall St is general in nature. We provide commentary based on historical data and analyst forecasts only using an unbiased methodology and our articles are not intended to be financial advice. It does not constitute a recommendation to buy or sell any stock, and does not take account of your objectives, or your financial situation. We aim to bring you long-term focused analysis driven by fundamental data. Note that our analysis may not factor in the latest price-sensitive company announcements or qualitative material. Simply Wall St has no position in any stocks mentioned.
New: Manage All Your Stock Portfolios in One Place
We've created the ultimate portfolio companion for stock investors, and it's free.
• Connect an unlimited number of Portfolios and see your total in one currency
• Be alerted to new Warning Signs or Risks via email or mobile
• Track the Fair Value of your stocks
Have feedback on this article? Concerned about the content? Get in touch with us directly. Alternatively, email editorial-team@simplywallst.com
About NasdaqGS:APP
AppLovin
Engages in building a software-based platform for advertisers to enhance the marketing and monetization of their content in the United States and internationally.
Exceptional growth potential with solid track record.
Similar Companies
Market Insights

Advertisement
Community Narratives
The company that turned a verb into a global necessity and basically runs the modern internet, digital ads, smartphones, maps, and AI.
Fair Value US$300.00|6.3% undervalued
OS
Community Contributor
Flowers Foods Pays A Fair Price For Health
Fair Value US$16.12|26.0% undervalued
NV
Community Contributor
TMX Group will thrive with 33.3% profit margin and enduring market moat
Fair Value CA$49.90|3.7% overvalued
LI
Community Contributor