
Advertisement
- United States
- /
- Software
- /
- NasdaqCM:ANY
Sphere 3D Corp. (NASDAQ:ANY) Stock's 34% Dive Might Signal An Opportunity But It Requires Some Scrutiny
The Sphere 3D Corp. (NASDAQ:ANY) share price has softened a substantial 34% over the previous 30 days, handing back much of the gains the stock has made lately. The recent drop completes a disastrous twelve months for shareholders, who are sitting on a 50% loss during that time.
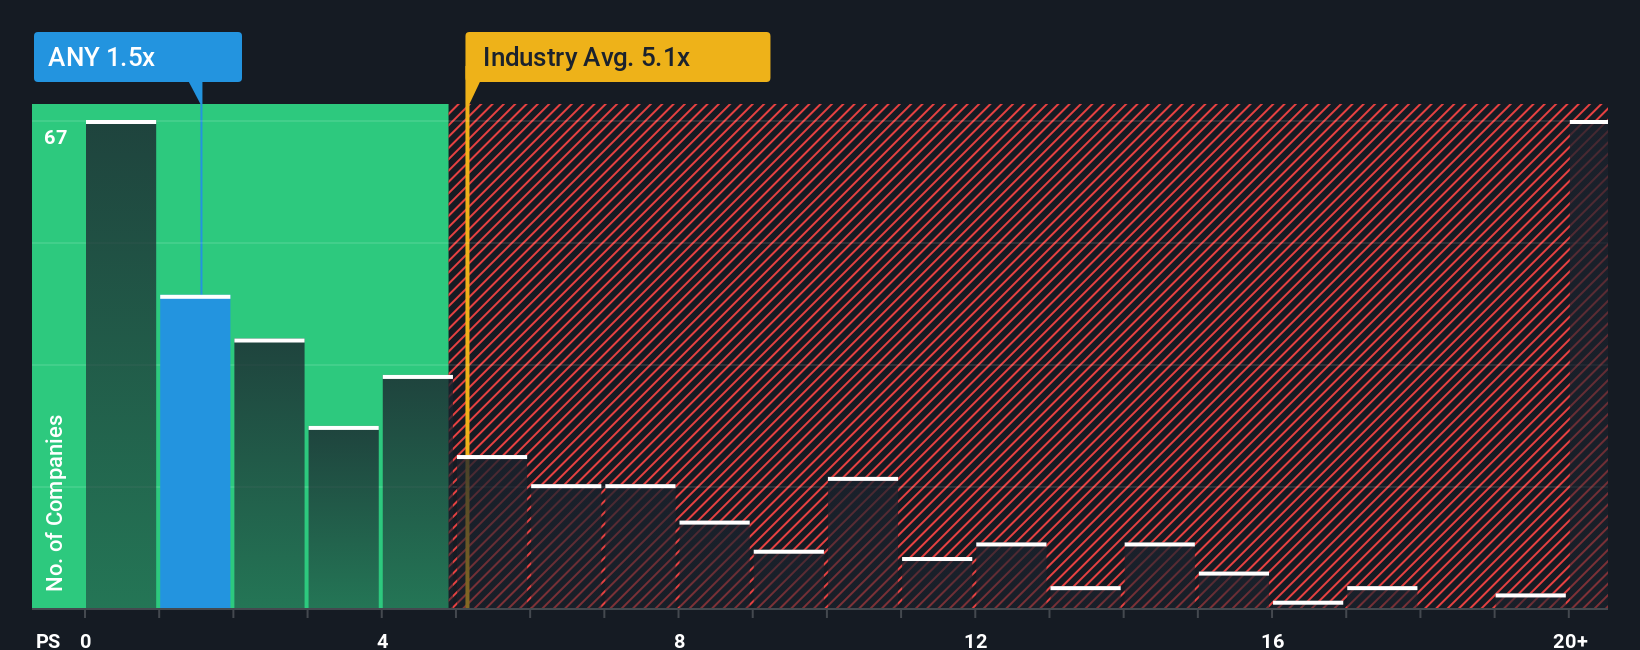
Following the heavy fall in price, Sphere 3D's price-to-sales (or "P/S") ratio of 1.5x might make it look like a strong buy right now compared to the wider Software industry in the United States, where around half of the companies have P/S ratios above 5.1x and even P/S above 12x are quite common. However, the P/S might be quite low for a reason and it requires further investigation to determine if it's justified.
View our latest analysis for Sphere 3D
What Does Sphere 3D's P/S Mean For Shareholders?
For instance, Sphere 3D's receding revenue in recent times would have to be some food for thought. Perhaps the market believes the recent revenue performance isn't good enough to keep up the industry, causing the P/S ratio to suffer. If you like the company, you'd be hoping this isn't the case so that you could potentially pick up some stock while it's out of favour.
We don't have analyst forecasts, but you can see how recent trends are setting up the company for the future by checking out our free report on Sphere 3D's earnings, revenue and cash flow.What Are Revenue Growth Metrics Telling Us About The Low P/S?
In order to justify its P/S ratio, Sphere 3D would need to produce anemic growth that's substantially trailing the industry.
In reviewing the last year of financials, we were disheartened to see the company's revenues fell to the tune of 57%. Even so, admirably revenue has lifted 97% in aggregate from three years ago, notwithstanding the last 12 months. Although it's been a bumpy ride, it's still fair to say the revenue growth recently has been more than adequate for the company.
When compared to the industry's one-year growth forecast of 21%, the most recent medium-term revenue trajectory is noticeably more alluring
With this information, we find it odd that Sphere 3D is trading at a P/S lower than the industry. Apparently some shareholders believe the recent performance has exceeded its limits and have been accepting significantly lower selling prices.
The Key Takeaway
Shares in Sphere 3D have plummeted and its P/S has followed suit. It's argued the price-to-sales ratio is an inferior measure of value within certain industries, but it can be a powerful business sentiment indicator.
Our examination of Sphere 3D revealed its three-year revenue trends aren't boosting its P/S anywhere near as much as we would have predicted, given they look better than current industry expectations. Potential investors that are sceptical over continued revenue performance may be preventing the P/S ratio from matching previous strong performance. While recent revenue trends over the past medium-term suggest that the risk of a price decline is low, investors appear to perceive a likelihood of revenue fluctuations in the future.
And what about other risks? Every company has them, and we've spotted 5 warning signs for Sphere 3D (of which 3 can't be ignored!) you should know about.
It's important to make sure you look for a great company, not just the first idea you come across. So if growing profitability aligns with your idea of a great company, take a peek at this free list of interesting companies with strong recent earnings growth (and a low P/E).
New: Manage All Your Stock Portfolios in One Place
We've created the ultimate portfolio companion for stock investors, and it's free.
• Connect an unlimited number of Portfolios and see your total in one currency
• Be alerted to new Warning Signs or Risks via email or mobile
• Track the Fair Value of your stocks
Have feedback on this article? Concerned about the content? Get in touch with us directly. Alternatively, email editorial-team (at) simplywallst.com.
This article by Simply Wall St is general in nature. We provide commentary based on historical data and analyst forecasts only using an unbiased methodology and our articles are not intended to be financial advice. It does not constitute a recommendation to buy or sell any stock, and does not take account of your objectives, or your financial situation. We aim to bring you long-term focused analysis driven by fundamental data. Note that our analysis may not factor in the latest price-sensitive company announcements or qualitative material. Simply Wall St has no position in any stocks mentioned.
About NasdaqCM:ANY
Moderate risk with adequate balance sheet.
Similar Companies
Market Insights

Advertisement
Community Narratives
The company that turned a verb into a global necessity and basically runs the modern internet, digital ads, smartphones, maps, and AI.
Fair Value US$300.00|5.2% undervalued
OS
Community Contributor
Flowers Foods Pays A Fair Price For Health
Fair Value US$16.12|24.9% undervalued
NV
Community Contributor
TMX Group will thrive with 33.3% profit margin and enduring market moat
Fair Value CA$49.90|3.3% overvalued
LI
Community Contributor
The "Molecular Pencil": Why Beam's Technology is Built to Win
Fair Value US$65.01|64.5% undervalued
DA
Community Contributor