Stock Analysis
- United States
- /
- Semiconductors
- /
- NasdaqGS:QCOM
Is QUALCOMM Incorporated's (NASDAQ:QCOM) Recent Stock Performance Tethered To Its Strong Fundamentals?


Most readers would already be aware that QUALCOMM's (NASDAQ:QCOM) stock increased significantly by 21% over the past three months. Given that the market rewards strong financials in the long-term, we wonder if that is the case in this instance. Specifically, we decided to study QUALCOMM's ROE in this article.
Return on equity or ROE is an important factor to be considered by a shareholder because it tells them how effectively their capital is being reinvested. Put another way, it reveals the company's success at turning shareholder investments into profits.
View our latest analysis for QUALCOMM
How Is ROE Calculated?
Return on equity can be calculated by using the formula:
Return on Equity = Net Profit (from continuing operations) ÷ Shareholders' Equity
So, based on the above formula, the ROE for QUALCOMM is:
35% = US$8.5b ÷ US$24b (Based on the trailing twelve months to March 2024).
The 'return' is the income the business earned over the last year. That means that for every $1 worth of shareholders' equity, the company generated $0.35 in profit.
What Is The Relationship Between ROE And Earnings Growth?
Thus far, we have learned that ROE measures how efficiently a company is generating its profits. Based on how much of its profits the company chooses to reinvest or "retain", we are then able to evaluate a company's future ability to generate profits. Assuming everything else remains unchanged, the higher the ROE and profit retention, the higher the growth rate of a company compared to companies that don't necessarily bear these characteristics.
QUALCOMM's Earnings Growth And 35% ROE
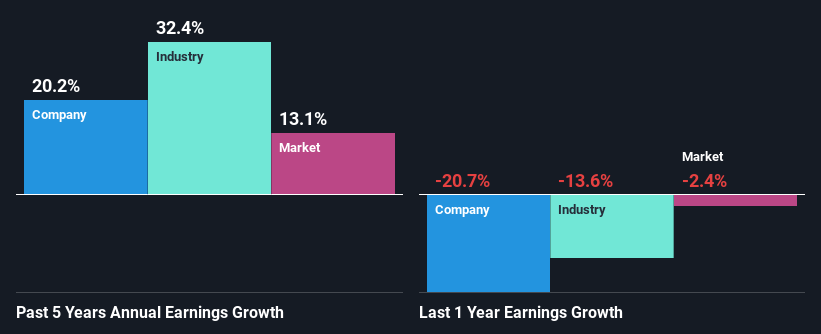
To begin with, QUALCOMM has a pretty high ROE which is interesting. Additionally, the company's ROE is higher compared to the industry average of 15% which is quite remarkable. As a result, QUALCOMM's exceptional 20% net income growth seen over the past five years, doesn't come as a surprise.
We then compared QUALCOMM's net income growth with the industry and found that the company's growth figure is lower than the average industry growth rate of 32% in the same 5-year period, which is a bit concerning.
The basis for attaching value to a company is, to a great extent, tied to its earnings growth. What investors need to determine next is if the expected earnings growth, or the lack of it, is already built into the share price. This then helps them determine if the stock is placed for a bright or bleak future. What is QCOM worth today? The intrinsic value infographic in our free research report helps visualize whether QCOM is currently mispriced by the market.
Is QUALCOMM Efficiently Re-investing Its Profits?
QUALCOMM has a three-year median payout ratio of 32% (where it is retaining 68% of its income) which is not too low or not too high. By the looks of it, the dividend is well covered and QUALCOMM is reinvesting its profits efficiently as evidenced by its exceptional growth which we discussed above.
Besides, QUALCOMM has been paying dividends for at least ten years or more. This shows that the company is committed to sharing profits with its shareholders. Our latest analyst data shows that the future payout ratio of the company over the next three years is expected to be approximately 29%. Therefore, the company's future ROE is also not expected to change by much with analysts predicting an ROE of 36%.
Conclusion
On the whole, we feel that QUALCOMM's performance has been quite good. Specifically, we like that the company is reinvesting a huge chunk of its profits at a high rate of return. This of course has caused the company to see a good amount of growth in its earnings. That being so, a study of the latest analyst forecasts show that the company is expected to see a slowdown in its future earnings growth. To know more about the latest analysts predictions for the company, check out this visualization of analyst forecasts for the company.
Valuation is complex, but we're helping make it simple.
Find out whether QUALCOMM is potentially over or undervalued by checking out our comprehensive analysis, which includes fair value estimates, risks and warnings, dividends, insider transactions and financial health.
View the Free AnalysisHave feedback on this article? Concerned about the content? Get in touch with us directly. Alternatively, email editorial-team (at) simplywallst.com.
This article by Simply Wall St is general in nature. We provide commentary based on historical data and analyst forecasts only using an unbiased methodology and our articles are not intended to be financial advice. It does not constitute a recommendation to buy or sell any stock, and does not take account of your objectives, or your financial situation. We aim to bring you long-term focused analysis driven by fundamental data. Note that our analysis may not factor in the latest price-sensitive company announcements or qualitative material. Simply Wall St has no position in any stocks mentioned.
Valuation is complex, but we're helping make it simple.
Find out whether QUALCOMM is potentially over or undervalued by checking out our comprehensive analysis, which includes fair value estimates, risks and warnings, dividends, insider transactions and financial health.
View the Free AnalysisHave feedback on this article? Concerned about the content? Get in touch with us directly. Alternatively, email editorial-team@simplywallst.com
About NasdaqGS:QCOM
QUALCOMM
Engages in the development and commercialization of foundational technologies for the wireless industry worldwide.
Flawless balance sheet, undervalued and pays a dividend.
