Advertisement
- United States
- /
- Semiconductors
- /
- NasdaqGS:QCOM
Exploring Qualcomm’s Valuation After Stock Drops 6.6% Despite AI Expansion News

Simply Wall St
Reviewed by Bailey Pemberton
- Wondering if QUALCOMM's current share price truly reflects its value? You are not alone, especially given all the noise in the market right now.
- After a strong surge earlier this year, QUALCOMM has cooled off. The stock is down 6.6% over the last week and 1.2% for the past month, yet it is still up 7.4% year-to-date and has gained 9.4% in the past year.
- Recent headlines focus on QUALCOMM's continued leadership in wireless technology, new chip partnerships, and expansion into AI-enabled devices. These developments have kept the company in the spotlight and influenced investor sentiment. These industry moves help explain why QUALCOMM often moves independently from sector trends, making its valuation worth a closer look.
- On our valuation checks, QUALCOMM scores 4 out of 6, suggesting some areas where the stock still appears undervalued. Let's unpack what those valuation approaches reveal, and stay tuned for an additional perspective on assessing value at the end.
Find out why QUALCOMM's 9.4% return over the last year is lagging behind its peers.
Approach 1: QUALCOMM Discounted Cash Flow (DCF) Analysis
The Discounted Cash Flow (DCF) model estimates a company's value by projecting its future cash flows and discounting them back to today's dollars. This method helps investors understand what a business is actually worth, based on its capacity to generate cash over time.
For QUALCOMM, the latest reported Free Cash Flow stands at $12.6 billion. Analysts project steady growth, with forecasts reaching $18.4 billion by 2030. It is important to note that while analyst estimates cover around five years, the projections beyond that rely on methodical extrapolation.
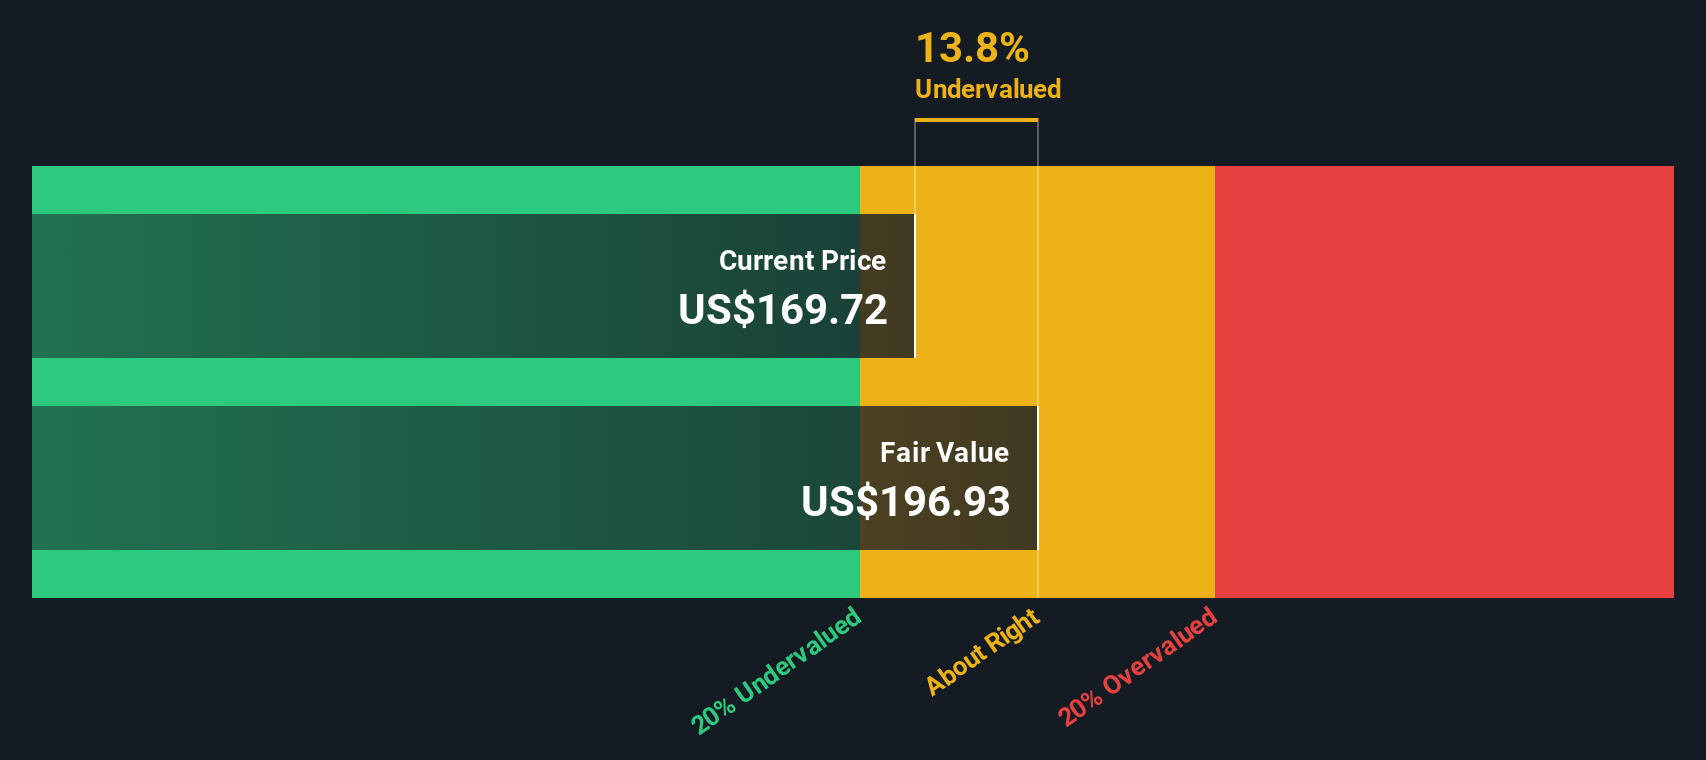
Based on these cash flow estimates and the two-stage Free Cash Flow to Equity model, QUALCOMM's intrinsic value is calculated at $202.48 per share. This figure is 18.5% higher than the current market price, indicating a meaningful undervaluation.
In summary, the DCF approach suggests QUALCOMM stock is trading at a discount. This may offer upside potential for long-term investors looking for value supported by projected cash generation.
Result: UNDERVALUED
Our Discounted Cash Flow (DCF) analysis suggests QUALCOMM is undervalued by 18.5%. Track this in your watchlist or portfolio, or discover 908 more undervalued stocks based on cash flows.
Approach 2: QUALCOMM Price vs Earnings
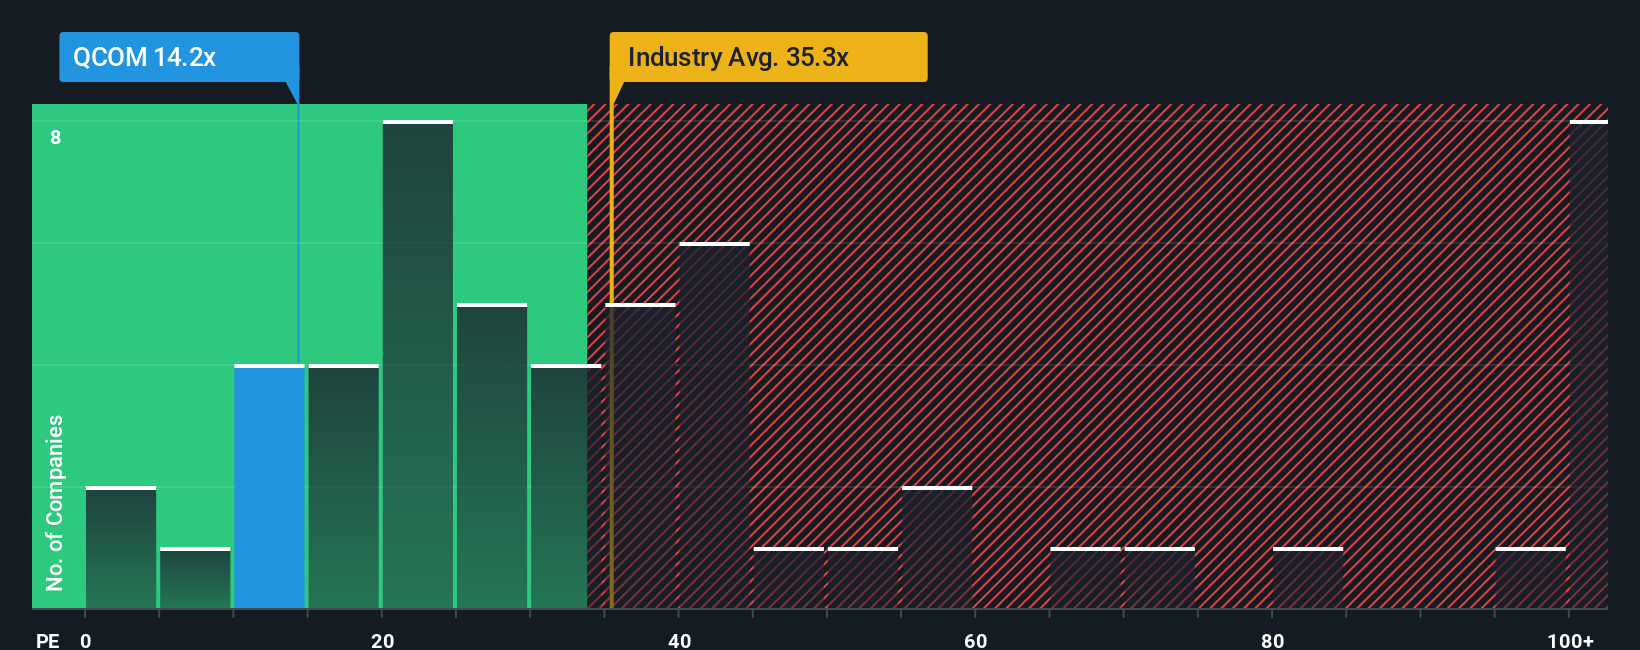
The Price-to-Earnings (PE) ratio is a widely used metric for valuing profitable companies, as it connects a company's share price with its earnings power. For established businesses like QUALCOMM, which regularly generates profits, the PE ratio helps investors compare how much they are paying for each dollar of earnings versus alternatives.
What is considered a "normal" or "fair" PE ratio depends on factors such as future growth expectations and perceived risks. Companies with stronger growth prospects or lower risks typically command higher PE multiples. Those facing more uncertainty or slower growth tend to trade at lower ratios.
QUALCOMM's current PE ratio is 31.8x, which is just under the semiconductor industry average of 33.6x and considerably below the average of its peers at 72.6x. While peer comparisons are useful for context, they may not reflect the specific growth profile and risk level of QUALCOMM.
This is where Simply Wall St's Fair Ratio comes in. The Fair Ratio for QUALCOMM is 40.7x, taking into account the company's expected earnings growth, profit margins, industry position, scale, and risk. This tailored approach is more insightful than a simple peer or industry comparison because it aligns expectations with QUALCOMM's own fundamentals rather than generic sector averages.
Comparing QUALCOMM's PE ratio of 31.8x with its Fair Ratio of 40.7x suggests that the stock is currently undervalued on this metric.
Result: UNDERVALUED
PE ratios tell one story, but what if the real opportunity lies elsewhere? Discover 1421 companies where insiders are betting big on explosive growth.
Upgrade Your Decision Making: Choose your QUALCOMM Narrative
Earlier, we mentioned that there is an even better way to understand valuation, so let us introduce you to Narratives. A Narrative is simply your investment story. It is your perspective on how QUALCOMM’s business will perform, including what you think is a fair value, and your own estimates about future revenue, earnings, and profit margins.
Instead of just looking at ratios or analyst targets, using a Narrative means you connect the company’s story to a financial forecast, and then to your personal fair value. This turns abstract numbers into actionable insights that reflect your view of QUALCOMM’s future.
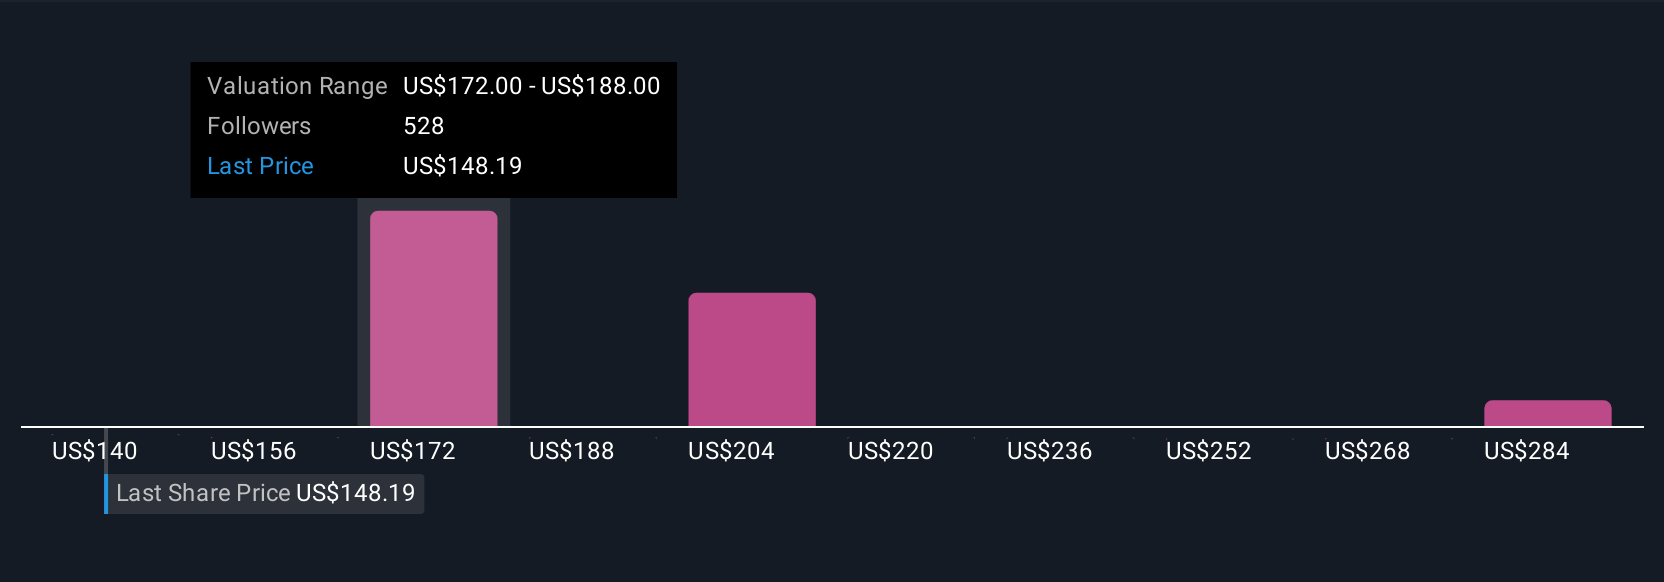
Narratives are quick and accessible for all users on Simply Wall St’s Community page, where millions of investors share and update their perspectives. Each Narrative is dynamic, automatically adjusting as new news, earnings, or company updates come in, keeping your view always up-to-date.
This approach helps you decide when to buy or sell by comparing your fair value to the current share price, anchoring investment decisions in your own grounded thesis. For example, some investors see QUALCOMM’s momentum in AI and automotive, projecting a fair value as high as $300, while others factor in competitive or regulatory risks and estimate a value closer to $140. This illustrates how Narratives turn market noise into clear, personal investment logic.
Do you think there's more to the story for QUALCOMM? Head over to our Community to see what others are saying!
This article by Simply Wall St is general in nature. We provide commentary based on historical data and analyst forecasts only using an unbiased methodology and our articles are not intended to be financial advice. It does not constitute a recommendation to buy or sell any stock, and does not take account of your objectives, or your financial situation. We aim to bring you long-term focused analysis driven by fundamental data. Note that our analysis may not factor in the latest price-sensitive company announcements or qualitative material. Simply Wall St has no position in any stocks mentioned.
Valuation is complex, but we're here to simplify it.
Discover if QUALCOMM might be undervalued or overvalued with our detailed analysis, featuring fair value estimates, potential risks, dividends, insider trades, and its financial condition.
Access Free AnalysisHave feedback on this article? Concerned about the content? Get in touch with us directly. Alternatively, email editorial-team@simplywallst.com
About NasdaqGS:QCOM
QUALCOMM
Engages in the development and commercialization of foundational technologies for the wireless industry worldwide.
Flawless balance sheet, undervalued and pays a dividend.
Similar Companies
Market Insights

Advertisement
Community Narratives
MicroVision will explode future revenue by 380.37% with a vision towards success
Fair Value US$60.00|98.5% undervalued
TH
Community Contributor
The Indispensable Artery for a New North American Economy
Fair Value CA$132.87|2.3% undervalued
TI
Community Contributor