Advertisement
- United States
- /
- Semiconductors
- /
- NasdaqGS:OLED
Is Universal Display (OLED) Pricing Reflect Future OLED Growth Or Stretching Current Valuation Limits

Reviewed by Bailey Pemberton
- If you are wondering whether Universal Display's share price reflects its true worth today, you are not alone. This article will walk through what the current numbers might be telling you about value.
- The stock most recently closed at US$123.66, with returns of 5.9% over 7 days, 1.8% over 30 days, 1.5% year to date and a 17.4% decline over the past year. These figures can change how investors think about both opportunity and risk.
- Recent attention on Universal Display has been shaped by ongoing interest in OLED technology and its role in consumer electronics and display supply chains. This context, along with sector and sentiment shifts, helps frame the mixed return profile you are seeing today.
- On our simple valuation checklist, Universal Display scores 3 out of 6. Next we will look at how different valuation approaches line up with that score and why there may be an even better way to think about value by the end of this article.
Find out why Universal Display's -17.4% return over the last year is lagging behind its peers.
Approach 1: Universal Display Discounted Cash Flow (DCF) Analysis
The DCF model takes expected future cash flows and discounts them back to what they might be worth to you in today’s dollars. For Universal Display, the model uses a 2 Stage Free Cash Flow to Equity approach, starting from last twelve months free cash flow of about $137.27 million.
Analysts provide explicit projections out to 2029, with estimates such as $238.34 million in 2026 and $205.34 million in 2029. Beyond these estimates, Simply Wall St extrapolates cash flows out to 2035, with discounted values in the model ranging from about $215.63 million in 2026 to $74.10 million in 2035.
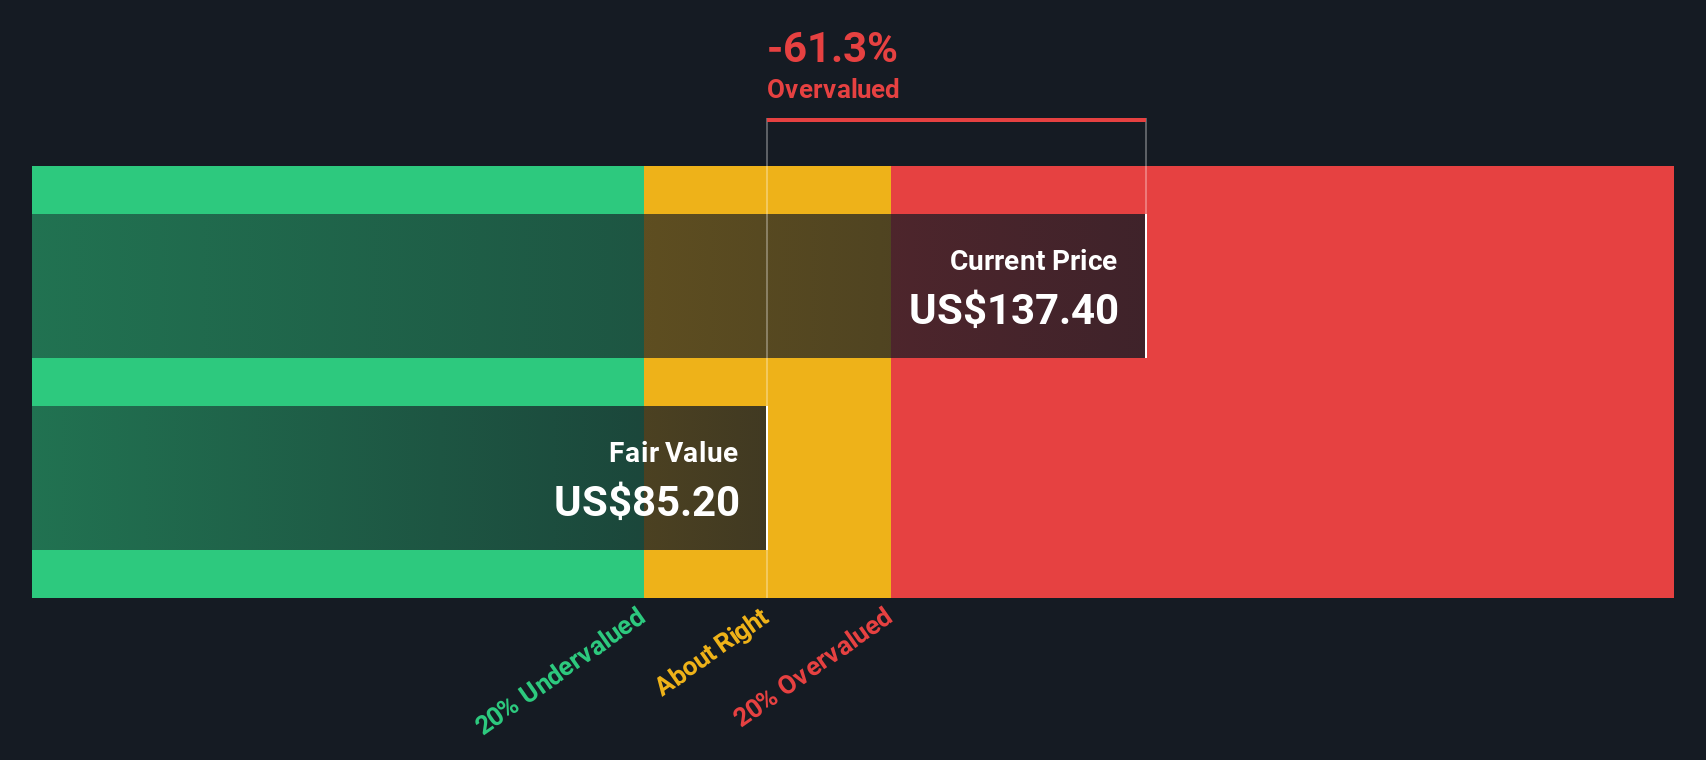
When all those discounted cash flows are added up, the model arrives at an estimated intrinsic value of about $48.19 per share, compared with the recent share price of $123.66. The implied intrinsic discount suggests the stock is 156.6% above this DCF estimate, which points to a rich valuation on this methodology alone.
Result: OVERVALUED
Our Discounted Cash Flow (DCF) analysis suggests Universal Display may be overvalued by 156.6%. Discover 884 undervalued stocks or create your own screener to find better value opportunities.
Approach 2: Universal Display Price vs Earnings
For a profitable business like Universal Display, the P/E ratio is a useful way to relate what you pay per share to the earnings the company generates. It lets you compare how the market prices each dollar of earnings across different companies.
A higher or lower P/E often reflects what investors expect for future earnings growth and how much risk they see in those earnings. Stronger growth or lower perceived risk can support a higher P/E, while slower growth or higher risk can justify a lower one.
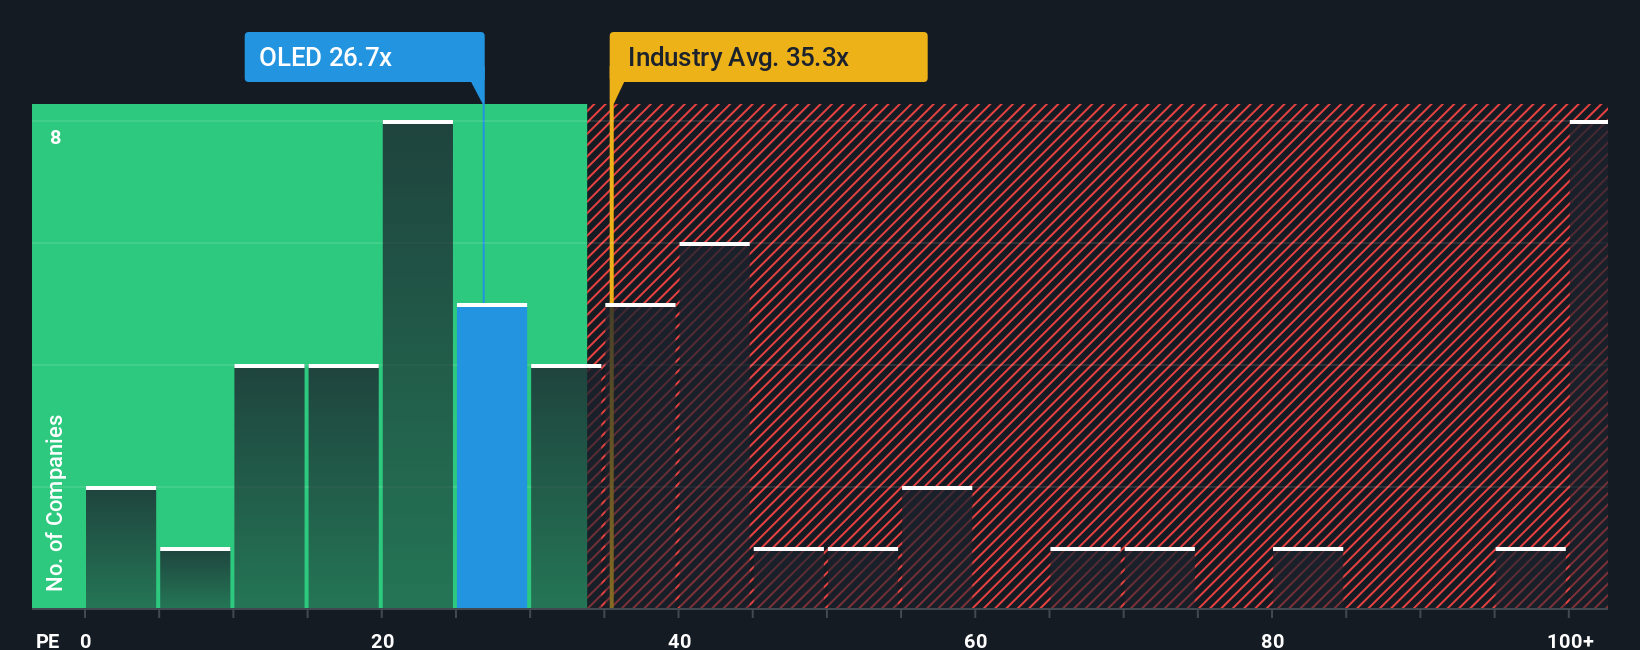
Universal Display currently trades on a P/E of 26.54x. That sits below the Semiconductor industry average of 42.34x and the peer group average of 34.11x. Simply Wall St also calculates a proprietary “Fair Ratio” of 23.66x, which is the P/E you might expect given factors such as the company’s earnings growth profile, industry, profit margin, market cap and specific risks.
This Fair Ratio can be more informative than a simple peer or industry comparison because it aims to account for those company specific drivers rather than treating all semiconductor stocks as alike. With the current P/E of 26.54x above the Fair Ratio of 23.66x, Universal Display screens as trading on a richer multiple using this approach.
Result: OVERVALUED
P/E ratios tell one story, but what if the real opportunity lies elsewhere? Discover 1443 companies where insiders are betting big on explosive growth.
Upgrade Your Decision Making: Choose your Universal Display Narrative
Earlier we mentioned that there is an even better way to think about valuation, and on Simply Wall St that comes through Narratives, where you and other investors set out a clear story for Universal Display, link that story to explicit forecasts for revenue, earnings and margins, and arrive at a fair value that you can compare with the current share price. This is all available in an easy tool on the Community page that updates as news or earnings arrive. One investor might build a Narrative that supports a fair value near US$220 based on stronger OLED adoption, while another might see closer to US$160 as more reasonable. By weighing these different Narratives against the current price you can decide for yourself whether the stock looks closer to a buy, a hold or a sell for your own portfolio.
Do you think there's more to the story for Universal Display? Head over to our Community to see what others are saying!

This article by Simply Wall St is general in nature. We provide commentary based on historical data and analyst forecasts only using an unbiased methodology and our articles are not intended to be financial advice. It does not constitute a recommendation to buy or sell any stock, and does not take account of your objectives, or your financial situation. We aim to bring you long-term focused analysis driven by fundamental data. Note that our analysis may not factor in the latest price-sensitive company announcements or qualitative material. Simply Wall St has no position in any stocks mentioned.
New: AI Stock Screener & Alerts
Our new AI Stock Screener scans the market every day to uncover opportunities.
• Dividend Powerhouses (3%+ Yield)
• Undervalued Small Caps with Insider Buying
• High growth Tech and AI Companies
Or build your own from over 50 metrics.
Have feedback on this article? Concerned about the content? Get in touch with us directly. Alternatively, email editorial-team@simplywallst.com
About NasdaqGS:OLED
Universal Display
Engages in the research, development, and commercialization of organic light emitting diode (OLED) technologies and materials for use in display and solid-state lighting applications.
Flawless balance sheet and fair value.
Similar Companies
Market Insights


Advertisement
Weekly Picks
ST


stuart_roberts on Upside Gold ·
An Undervalued 3.3Moz Gold Project in Canada
Fair Value:CA$5.0768.4% undervalued
292 followersusers have followed this narrative
1 commentusers have commented on this narrative
45 likesusers have liked this narrative
GO

GoldenSands on QuantumScape ·
QuantumScape: A Mispriced Deep‑Tech Inflection Point With Multi‑Billion‑Dollar Optionality
Fair Value:US$8590.6% undervalued
106 followersusers have followed this narrative
2 commentsusers have commented on this narrative
31 likesusers have liked this narrative
TO


Tokyo on Anheuser-Busch InBev ·
EU#8 - Anheuser-Busch InBev: Courage, Capital, and the Discipline to Build an Empire
Fair Value:€89.4524.2% undervalued
8 followersusers have followed this narrative
3 commentsusers have commented on this narrative
4 likesusers have liked this narrative
OS


oscargarcia on Amazon.com ·
The capitalist colossus that makes your parcels magically appear, powers half the internet, and knows your shopping habits.
Fair Value:US$2803.9% undervalued
66 followersusers have followed this narrative
1 commentusers have commented on this narrative
2 likesusers have liked this narrative
Recently Updated Narratives
PO

PortfolioPlus on Alliance Aviation Services ·
Excellent management with a great sense of buying capital assets at the bottom of the cycle and deploying them against solid revenue streams
Fair Value:AU$2.8978.5% undervalued
1 followerusers have followed this narrative
2 commentsusers have commented on this narrative
0 likesusers have liked this narrative
FU

FundamentalFlow on Samsara ·
Samsara’s 30% ARR Growth Could Drive 70%+ Upside
Fair Value:US$6555.3% undervalued
1 followerusers have followed this narrative
0 commentsusers have commented on this narrative
0 likesusers have liked this narrative
RO


RockeTeller on Boab Metals ·
Aussie's Silver Play Ignored by Mr. Legend Eric Sprott
Fair Value:AU$11.6996.3% undervalued
5 followersusers have followed this narrative
4 commentsusers have commented on this narrative
1 likeusers have liked this narrative
Popular Narratives
GO
GoldenSands on QuantumScape ·
QuantumScape: A Mispriced Deep‑Tech Inflection Point With Multi‑Billion‑Dollar Optionality
Fair Value:US$8590.6% undervalued
106 followersusers have followed this narrative
2 commentsusers have commented on this narrative
31 likesusers have liked this narrative
KI

Kingman1152 on NVIDIA ·
NVIDIA will see a profit margin surge of 55% in the next 5 years
Fair Value:US$305.228.1% undervalued
70 followersusers have followed this narrative
2 commentsusers have commented on this narrative
24 likesusers have liked this narrative
AN


AnalystConsensusTarget on Microsoft ·
Analyst Commentary Highlights Microsoft AI Momentum and Upward Valuation Amid Growth and Competitive Risks
Fair Value:US$561.9326.6% undervalued
1399 followersusers have followed this narrative
2 commentsusers have commented on this narrative
12 likesusers have liked this narrative
