
Advertisement
- United States
- /
- Semiconductors
- /
- NasdaqGS:MKSI
These 4 Measures Indicate That MKS (NASDAQ:MKSI) Is Using Debt Reasonably Well

David Iben put it well when he said, 'Volatility is not a risk we care about. What we care about is avoiding the permanent loss of capital.' It's only natural to consider a company's balance sheet when you examine how risky it is, since debt is often involved when a business collapses. As with many other companies MKS Inc. (NASDAQ:MKSI) makes use of debt. But is this debt a concern to shareholders?
What Risk Does Debt Bring?
Generally speaking, debt only becomes a real problem when a company can't easily pay it off, either by raising capital or with its own cash flow. If things get really bad, the lenders can take control of the business. However, a more usual (but still expensive) situation is where a company must dilute shareholders at a cheap share price simply to get debt under control. Of course, debt can be an important tool in businesses, particularly capital heavy businesses. The first step when considering a company's debt levels is to consider its cash and debt together.
What Is MKS's Net Debt?
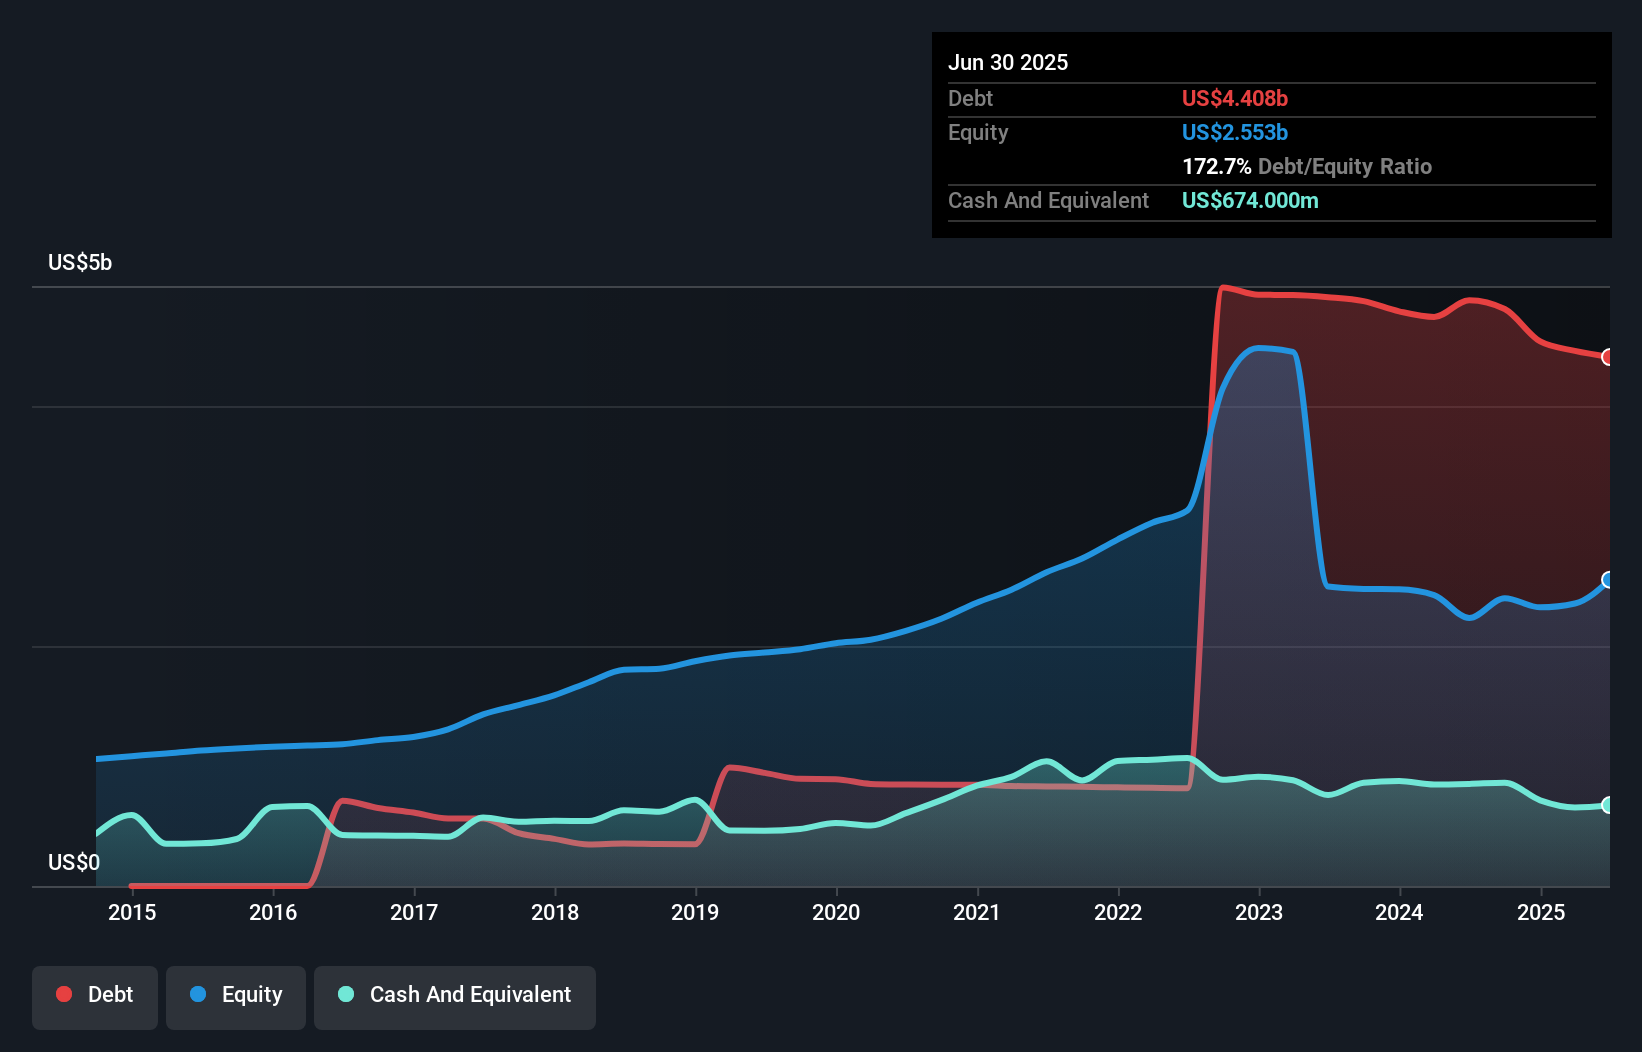
You can click the graphic below for the historical numbers, but it shows that MKS had US$4.41b of debt in June 2025, down from US$4.88b, one year before. However, because it has a cash reserve of US$674.0m, its net debt is less, at about US$3.73b.
How Healthy Is MKS' Balance Sheet?
The latest balance sheet data shows that MKS had liabilities of US$832.0m due within a year, and liabilities of US$5.44b falling due after that. On the other hand, it had cash of US$674.0m and US$649.0m worth of receivables due within a year. So its liabilities outweigh the sum of its cash and (near-term) receivables by US$4.95b.
This is a mountain of leverage relative to its market capitalization of US$6.62b. Should its lenders demand that it shore up the balance sheet, shareholders would likely face severe dilution.
Check out our latest analysis for MKS
In order to size up a company's debt relative to its earnings, we calculate its net debt divided by its earnings before interest, tax, depreciation, and amortization (EBITDA) and its earnings before interest and tax (EBIT) divided by its interest expense (its interest cover). The advantage of this approach is that we take into account both the absolute quantum of debt (with net debt to EBITDA) and the actual interest expenses associated with that debt (with its interest cover ratio).
MKS's debt is 4.2 times its EBITDA, and its EBIT cover its interest expense 2.6 times over. This suggests that while the debt levels are significant, we'd stop short of calling them problematic. However, one redeeming factor is that MKS grew its EBIT at 11% over the last 12 months, boosting its ability to handle its debt. The balance sheet is clearly the area to focus on when you are analysing debt. But it is future earnings, more than anything, that will determine MKS's ability to maintain a healthy balance sheet going forward. So if you're focused on the future you can check out this free report showing analyst profit forecasts.
But our final consideration is also important, because a company cannot pay debt with paper profits; it needs cold hard cash. So we clearly need to look at whether that EBIT is leading to corresponding free cash flow. Over the most recent three years, MKS recorded free cash flow worth 79% of its EBIT, which is around normal, given free cash flow excludes interest and tax. This cold hard cash means it can reduce its debt when it wants to.
Our View
When it comes to the balance sheet, the standout positive for MKS was the fact that it seems able to convert EBIT to free cash flow confidently. But the other factors we noted above weren't so encouraging. In particular, interest cover gives us cold feet. When we consider all the factors mentioned above, we do feel a bit cautious about MKS's use of debt. While we appreciate debt can enhance returns on equity, we'd suggest that shareholders keep close watch on its debt levels, lest they increase. When analysing debt levels, the balance sheet is the obvious place to start. However, not all investment risk resides within the balance sheet - far from it. For example, we've discovered 1 warning sign for MKS that you should be aware of before investing here.
Of course, if you're the type of investor who prefers buying stocks without the burden of debt, then don't hesitate to discover our exclusive list of net cash growth stocks, today.
New: Manage All Your Stock Portfolios in One Place
We've created the ultimate portfolio companion for stock investors, and it's free.
• Connect an unlimited number of Portfolios and see your total in one currency
• Be alerted to new Warning Signs or Risks via email or mobile
• Track the Fair Value of your stocks
Have feedback on this article? Concerned about the content? Get in touch with us directly. Alternatively, email editorial-team (at) simplywallst.com.
This article by Simply Wall St is general in nature. We provide commentary based on historical data and analyst forecasts only using an unbiased methodology and our articles are not intended to be financial advice. It does not constitute a recommendation to buy or sell any stock, and does not take account of your objectives, or your financial situation. We aim to bring you long-term focused analysis driven by fundamental data. Note that our analysis may not factor in the latest price-sensitive company announcements or qualitative material. Simply Wall St has no position in any stocks mentioned.
About NasdaqGS:MKSI
MKS
Provides foundational technology solutions to semiconductor manufacturing, electronics and packaging, and specialty industrial applications in the United States, China, South Korea, Japan, Taiwan, Singapore, and internationally.
Proven track record with moderate growth potential.
Similar Companies
Market Insights

Advertisement
Community Narratives
MicroVision will explode future revenue by 380.37% with a vision towards success
Fair Value US$60|98.4% undervalued
TH
Community Contributor
The Indispensable Artery for a New North American Economy
Fair Value CA$132.87|0.7% overvalued
TI
Community Contributor
Recently Updated Narratives
CE

cementafriend on Constellation Energy ·
Constellation Energy Dividends and Growth
Fair Value:US$348.054.7% overvalued
2 followersusers have followed this narrative
0 commentsusers have commented on this narrative
0 likesusers have liked this narrative
KH

Khagani on CoreWeave ·
CoreWeave's Revenue Expected to Rocket 77.88% in 5-Year Forecast
Fair Value:US$11033.5% undervalued
3 followersusers have followed this narrative
0 commentsusers have commented on this narrative
0 likesusers have liked this narrative
PO

PortfolioPlus on Bisalloy Steel Group ·
Bisalloy Steel Group will shine with a projected profit margin increase of 12.8%
Fair Value:AU$6.7118.0% undervalued
2 followersusers have followed this narrative
0 commentsusers have commented on this narrative
0 likesusers have liked this narrative
Popular Narratives
TH

TheWallstreetKing on MicroVision ·
MicroVision will explode future revenue by 380.37% with a vision towards success
Fair Value:US$6098.4% undervalued
106 followersusers have followed this narrative
10 commentsusers have commented on this narrative
21 likesusers have liked this narrative
AN


AnalystConsensusTarget on NVIDIA ·
NVDA: Expanding AI Demand Will Drive Major Data Center Investments Through 2026
Fair Value:US$250.3929.3% undervalued
935 followersusers have followed this narrative
6 commentsusers have commented on this narrative
24 likesusers have liked this narrative
OS


oscargarcia on Alphabet ·
The company that turned a verb into a global necessity and basically runs the modern internet, digital ads, smartphones, maps, and AI.
Fair Value:US$3405.8% undervalued
142 followersusers have followed this narrative
6 commentsusers have commented on this narrative
18 likesusers have liked this narrative