Advertisement
- United States
- /
- Semiconductors
- /
- NasdaqGS:AMAT
What Do Recent AI Chip Gains Mean for Applied Materials in 2025?

Simply Wall St
Reviewed by Bailey Pemberton
Thinking about what to do next with Applied Materials stock? You are far from alone. This high-profile chip industry name has been on quite the ride lately, attracting investors who chase not just momentum, but value too. It can feel tricky to decide whether to lock in gains, initiate a new position, or simply watch from the sidelines, especially when price swings and valuation talk are both in the headlines.
Let us break down what has been happening. Over the past month, Applied Materials has surged an eye-catching 34.2%, riding a wave of investor optimism fueled by ongoing buzz around semiconductor demand and broader market enthusiasm for AI-related stocks. At the same time, the last week has been pretty flat, at -0.1%, hinting that rapid gains might be taking a breather. The year-to-date return sits at 32.7%, and if you zoom out over 3 or even 5 years, the returns get even more impressive, up 194.1% and 255.4% respectively. Clearly, some long-term believers have been rewarded, but these jumps can also signal rising expectations and potential new risks being priced in.
So, is the stock still undervalued after such a run? Based on six classic valuation checkpoints, Applied Materials scores 3 out of 6, a solid, but not overwhelming, result. In the next section, I will walk you through each of these valuation methods and what they reveal about where the company stands today. And, stick around, because there is an even more effective way to size up Applied Materials’ true worth that I will get to at the end.
Why Applied Materials is lagging behind its peers
Approach 1: Applied Materials Discounted Cash Flow (DCF) Analysis
The Discounted Cash Flow (DCF) model is a fundamental valuation method that estimates the intrinsic value of a company by projecting its future cash flows and discounting them back to today's dollars. This approach helps investors see what the business is truly worth, based on how much cash it is expected to generate over time.
For Applied Materials, the most recent reported Free Cash Flow stands at $6.31 billion. Analysts project ongoing growth, with Free Cash Flow expected to reach $9.51 billion by 2029. Forecasts become more speculative beyond that, so the further estimates for up to 10 years are extrapolated using industry-standard growth assumptions rather than direct analyst predictions.
Based on these cash flow projections, the DCF model calculates an intrinsic value of $161 per share. Compared to the current stock price, this suggests the shares are about 35.1% overvalued. In other words, the market is pricing in even stronger growth or profitability than what this DCF outlook supports.
Result: OVERVALUED
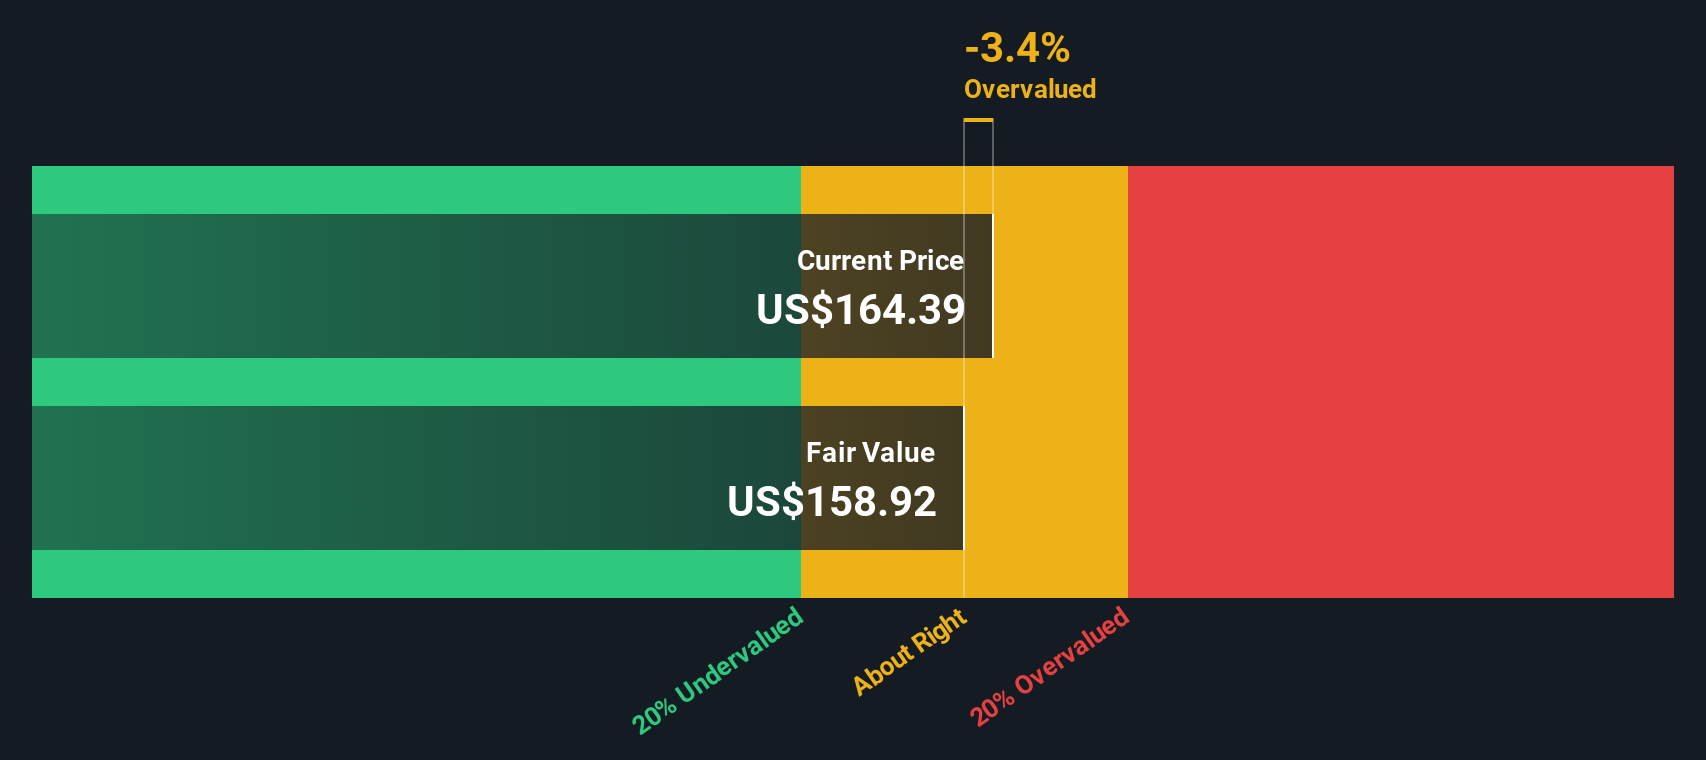
Our Discounted Cash Flow (DCF) analysis suggests Applied Materials may be overvalued by 35.1%. Find undervalued stocks or create your own screener to find better value opportunities.
Approach 2: Applied Materials Price vs Earnings
The Price-to-Earnings (PE) ratio is a popular metric for valuing profitable companies like Applied Materials because it directly relates the company’s current share price to its underlying earnings. For businesses generating steady profits, PE ratios offer a simple yet powerful lens into how much investors are paying for a dollar of earnings, and reflect the market’s collective outlook for growth and risk.
Growth expectations and risk play a major role in setting what is considered a “normal” or “fair” PE ratio. Higher growth companies, or those with more stable and predictable earnings, often command higher multiples. Riskier or slower-growth names typically trade at discounted PEs. Industry benchmarks help establish context, but every company has its own story.
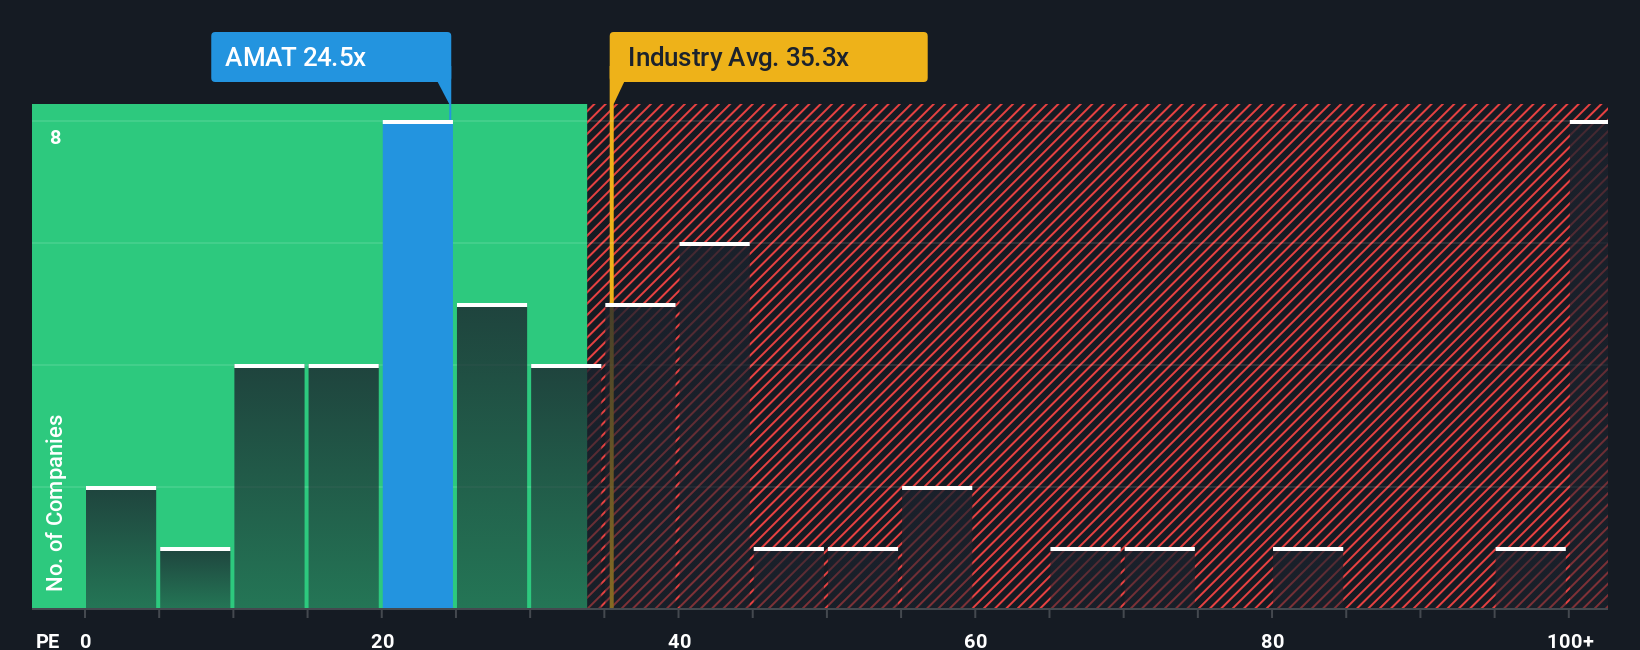
Applied Materials currently trades at a PE ratio of 25x. That is below both the semiconductor industry average of 38x and the peer average of 36x. On the surface, this makes the stock look attractively priced compared to its direct competitors.
Simply Wall St’s proprietary “Fair Ratio” refines this comparison by weighing factors like earnings growth, profit margins, industry characteristics, company size, and risk profile. The Fair Ratio aims to set a tailored benchmark for Applied Materials specifically. This personalized measure is typically more informative than just comparing with peers or sector medians because it aligns directly with the business’s prospects and circumstances.
For Applied Materials, the Fair Ratio is calculated at 32x, notably higher than its current PE. This suggests the market may not be fully pricing in the company’s strengths and future potential. In short, Applied Materials appears undervalued according to this approach.
Result: UNDERVALUED
PE ratios tell one story, but what if the real opportunity lies elsewhere? Discover companies where insiders are betting big on explosive growth.
Upgrade Your Decision Making: Choose your Applied Materials Narrative
Earlier we mentioned there is an even better way to understand valuation, so let us introduce you to Narratives. A Narrative is a simple, powerful tool that lets you define your own story for a company, linking your beliefs about its business outlook, growth drivers, and risks directly with your financial forecasts and target fair value.
On Simply Wall St, Narratives make it easy for anyone to document their assumptions, such as estimates for future revenue, profit margins, and the right multiple, and then instantly see how those translate into a fair value for the stock. Unlike static analysis, Narratives connect the big picture (“Why this company will thrive or struggle?”) with the specifics of expected financial performance, showing at a glance whether the share price justifies your conviction.
Because Narratives are dynamic, they update as soon as new news or earnings results are available, always reflecting the latest facts. You can find and create Narratives on the Simply Wall St Community page, where millions of investors post and discuss their perspectives.
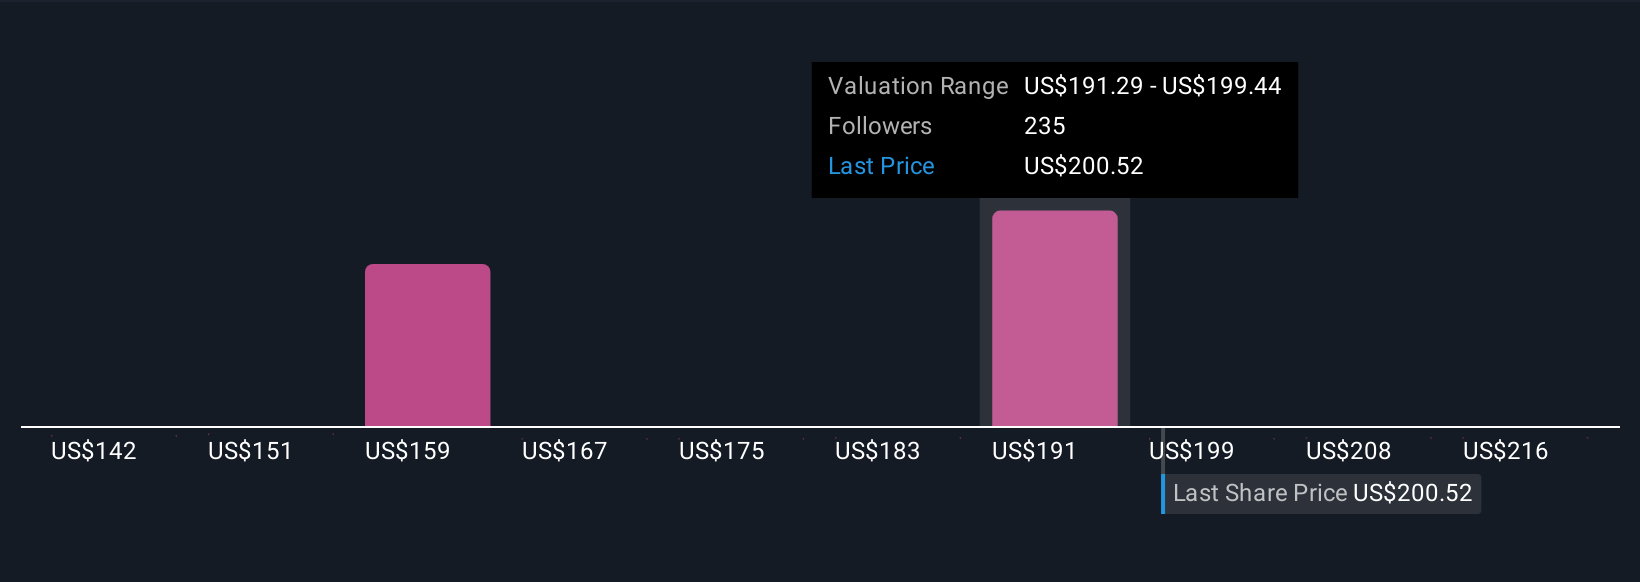
For Applied Materials, for instance, the most optimistic Narratives see revenue growing 7 to 12% per year and fair value as high as $240, while the most cautious highlight risks like China export restrictions, projecting slower growth and fair values near $160. With Narratives, you can confidently compare your view to others, sense-check your logic, and decide not only if it is time to buy or sell, but exactly why.
Do you think there's more to the story for Applied Materials? Create your own Narrative to let the Community know!
This article by Simply Wall St is general in nature. We provide commentary based on historical data and analyst forecasts only using an unbiased methodology and our articles are not intended to be financial advice. It does not constitute a recommendation to buy or sell any stock, and does not take account of your objectives, or your financial situation. We aim to bring you long-term focused analysis driven by fundamental data. Note that our analysis may not factor in the latest price-sensitive company announcements or qualitative material. Simply Wall St has no position in any stocks mentioned.
New: Manage All Your Stock Portfolios in One Place
We've created the ultimate portfolio companion for stock investors, and it's free.
• Connect an unlimited number of Portfolios and see your total in one currency
• Be alerted to new Warning Signs or Risks via email or mobile
• Track the Fair Value of your stocks
Have feedback on this article? Concerned about the content? Get in touch with us directly. Alternatively, email editorial-team@simplywallst.com
About NasdaqGS:AMAT
Applied Materials
Engages in the provision of manufacturing equipment, services, and software to the semiconductor, display, and related industries.
Flawless balance sheet and fair value.
Similar Companies
Market Insights

Advertisement
Community Narratives
MicroVision will explode future revenue by 380.37% with a vision towards success
Fair Value US$60|98.4% undervalued
TH
Community Contributor
The Indispensable Artery for a New North American Economy
Fair Value CA$132.87|0.6% undervalued
TI
Community Contributor
Recently Updated Narratives
MA


MarkoVT on COVER ·
Q3 Outlook modestly optimistic
Fair Value:JP¥1.65k2.0% overvalued
1 followerusers have followed this narrative
0 commentsusers have commented on this narrative
0 likesusers have liked this narrative
BL


BlackGoat on Alphabet ·
Alphabet: The Under-appreciated Compounder Hiding in Plain Sight
Fair Value:US$324.481.3% undervalued
76 followersusers have followed this narrative
3 commentsusers have commented on this narrative
1 likeusers have liked this narrative
BE


Bejgal on MINISO Group Holding ·
MINISO's fair value is projected at 26.69 with an anticipated PE ratio shift of 20x
Fair Value:US$26.6926.7% undervalued
46 followersusers have followed this narrative
3 commentsusers have commented on this narrative
0 likesusers have liked this narrative
Popular Narratives
OS

oscargarcia on Alphabet ·
The company that turned a verb into a global necessity and basically runs the modern internet, digital ads, smartphones, maps, and AI.
Fair Value:US$3405.9% undervalued
136 followersusers have followed this narrative
6 commentsusers have commented on this narrative
18 likesusers have liked this narrative
TH

TheWallstreetKing on MicroVision ·
MicroVision will explode future revenue by 380.37% with a vision towards success
Fair Value:US$6098.4% undervalued
89 followersusers have followed this narrative
10 commentsusers have commented on this narrative
18 likesusers have liked this narrative
AN


AnalystConsensusTarget on NVIDIA ·
NVDA: Expanding AI Demand Will Drive Major Data Center Investments Through 2026
Fair Value:US$232.7922.6% undervalued
928 followersusers have followed this narrative
6 commentsusers have commented on this narrative
22 likesusers have liked this narrative