Advertisement
- United States
- /
- Specialty Stores
- /
- NYSE:TJX
Has Strong Performance Made TJX Stock Too Expensive After Latest Retail News?

Simply Wall St
Reviewed by Bailey Pemberton
Thinking about buying, selling, or just holding on to your TJX Companies shares? You are not alone. With a consistent run of strong returns over the past several years, the stock keeps making its way into investor conversations. In the last week, the price dipped by a slight 0.1%. Zooming out, TJX is up 1.9% over the past month and a striking 17.5% so far this year. For loyal investors, the long-term gains have been even more impressive, rising 26.3% in the past year and more than doubling over three years, with a 195.6% surge over five years. Clearly, the market sees staying power and solid execution from this off-price retail giant.
Recent news continues to reinforce TJX’s staying power amid changing consumer habits. As shoppers increasingly hunt for value, TJX’s business model of delivering branded goods at a discount has been well-positioned to benefit. While other retailers worry about inventory excesses, TJX’s flexible buying approach and bargain focus make it a favorite landing spot for both customers and suppliers, especially in uncertain times. That tailwind arguably helped keep returns strong even as retail stumbled recently.
But past performance and strong headlines do not always guarantee a good buy today, and that is where valuation comes in. According to a composite score that adds a point for every underpriced metric out of six key checks, TJX Companies lands a value score of 0. In other words, none of these standard valuation screens suggest the stock is currently undervalued. So, should that concern you or is there more to the story? Next, I am going to break down these valuation measures. If you are looking for a more nuanced way to think about value, be sure to stick around for a deeper approach at the end.
TJX Companies scores just 0/6 on our valuation checks. See what other red flags we found in the full valuation breakdown.
Approach 1: TJX Companies Discounted Cash Flow (DCF) Analysis
A Discounted Cash Flow (DCF) model estimates a company’s intrinsic value by projecting its future cash flows and then discounting them back to their present value. This approach aims to answer what TJX Companies might truly be worth today, based on money it is expected to generate for shareholders over the long term.
Currently, TJX Companies produces around $4.05 billion in Free Cash Flow (FCF) each year. Analysts forecast FCF to steadily climb, projecting it will exceed $5.22 billion by 2029. While analysts directly provide estimates for up to five years, Simply Wall St extrapolates further growth and suggests FCF could reach approximately $6.25 billion ten years from now. All these figures are in US dollars.
Based on this 2 Stage Free Cash Flow to Equity model, the estimated intrinsic value for TJX Companies is $82.10 per share. When compared to the current share price, the DCF model implies the stock is 73.4% overvalued. This indicates investors are currently paying a significant premium above what these cash flows suggest is fair value.
Result: OVERVALUED
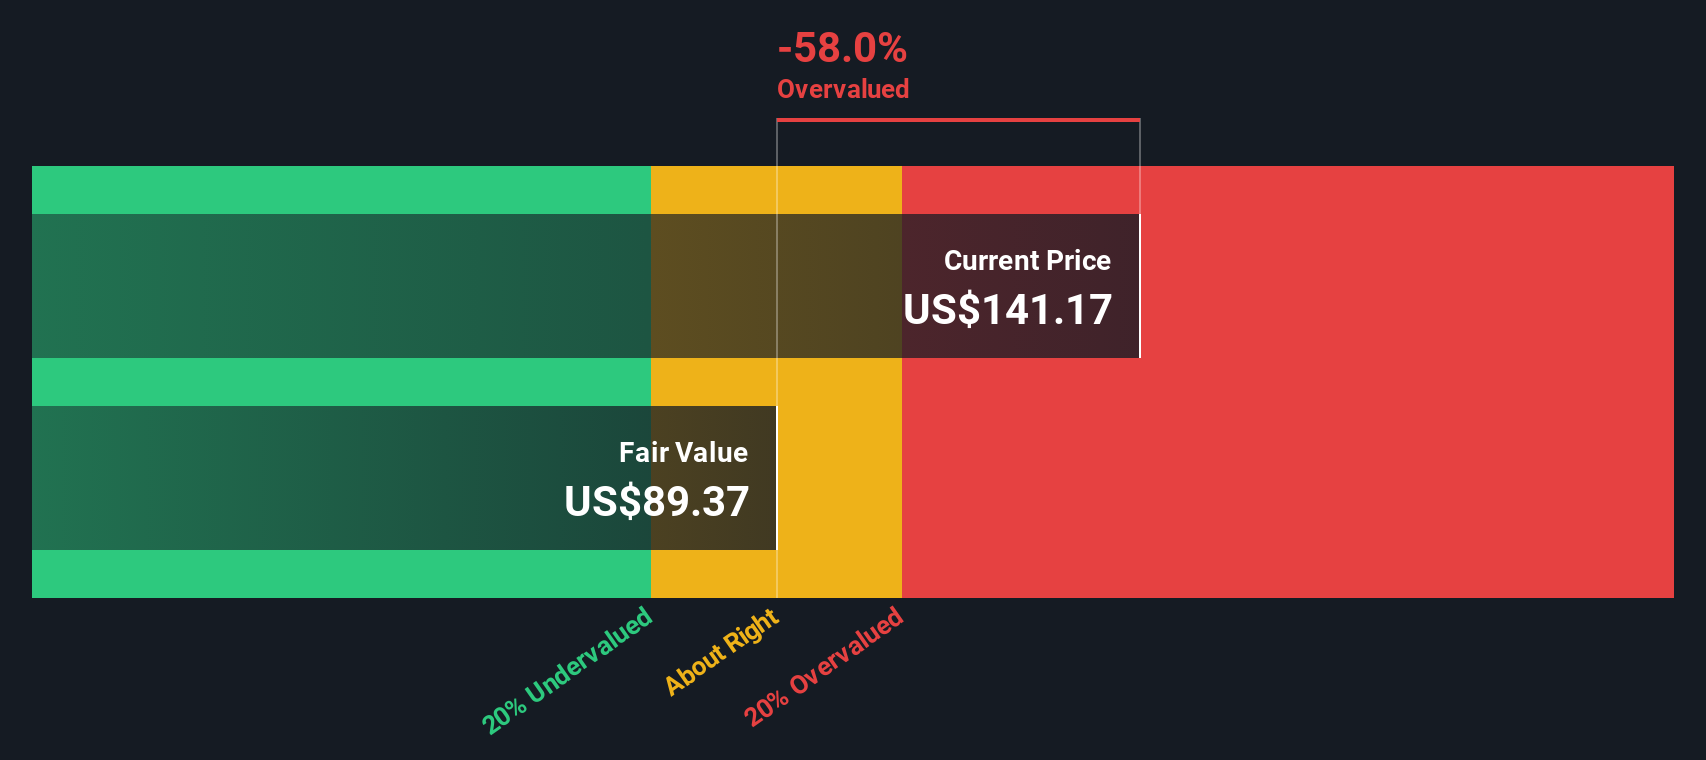
Our Discounted Cash Flow (DCF) analysis suggests TJX Companies may be overvalued by 73.4%. Find undervalued stocks or create your own screener to find better value opportunities.
Approach 2: TJX Companies Price vs Earnings
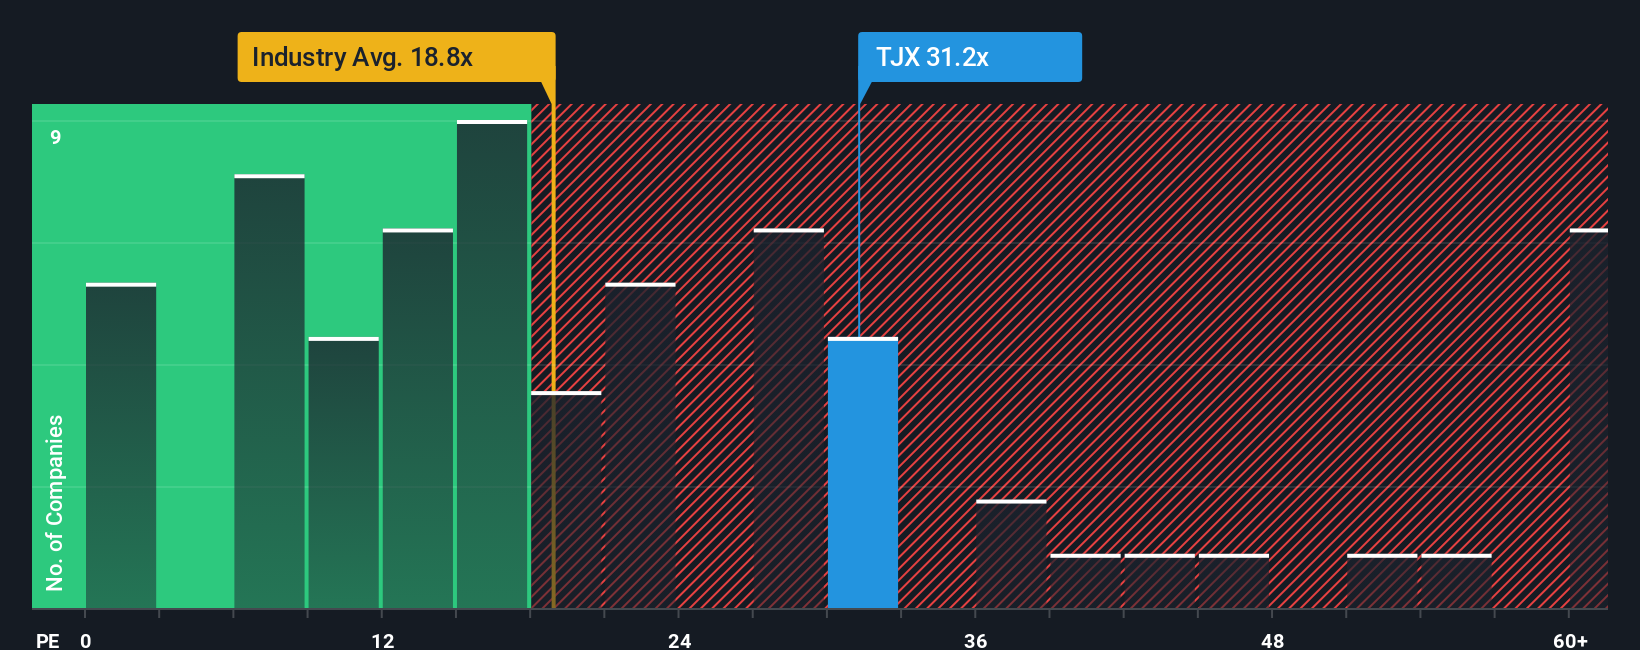
The Price-to-Earnings (PE) ratio is a popular valuation yardstick for profitable companies like TJX Companies, giving investors a quick sense of how much they are paying for each dollar of earnings. Because TJX has an established track record of profits, the PE ratio is an especially relevant figure to consider. Investors often use it to gauge how the market views the company’s growth potential and risk. Higher PE ratios tend to reflect expectations of strong future growth or lower risk, while lower values can signal limited upside or higher uncertainty.
Right now, TJX Companies sports a PE ratio of 31.9x. This is considerably higher than the Specialty Retail industry average of 16.7x and also above the direct peer group average of 19.4x. On the surface, this suggests the market sees something special in TJX, possibly pricing in outperformance versus competitors and sector peers.
However, Simply Wall St provides another tool called the “Fair Ratio” to put these numbers into better context. The Fair Ratio, calculated at 21.0x for TJX, incorporates not just industry standards and peer groups, but also the company’s own fundamentals such as earnings growth, profit margins, risk profile, and market cap. This proprietary figure offers a clearer view of what TJX “should” trade at compared to simply glancing at averages.
Comparing TJX’s actual PE of 31.9x to the Fair Ratio of 21.0x suggests the stock is trading at a significant premium relative to what its growth, quality, and risk would justify. This points to an overvalued signal using the preferred multiple approach.
Result: OVERVALUED
PE ratios tell one story, but what if the real opportunity lies elsewhere? Discover companies where insiders are betting big on explosive growth.
Upgrade Your Decision Making: Choose your TJX Companies Narrative
Earlier we mentioned that there is an even better way to understand valuation, so let us introduce you to Narratives. A Narrative is simply your story for how you believe a company like TJX Companies will perform in the future, backed by your personal expectations for its sales, earnings, and margins. Narratives link a company’s story or outlook to a concrete financial forecast and then to a fair value estimate, connecting what you believe will happen to what you think the stock should be worth.
This approach takes the numbers out of spreadsheets and places them in a framework that is both easy to use and highly flexible, all available within the Simply Wall St Community page used by millions of investors. With Narratives, you can instantly see how your view stacks up: if your estimated fair value is higher than today’s price, you might see an opportunity to buy, and if it is lower, it could be a signal to take profits or avoid the stock. As news breaks or earnings reports arrive, Narratives update dynamically, keeping your view relevant and current.
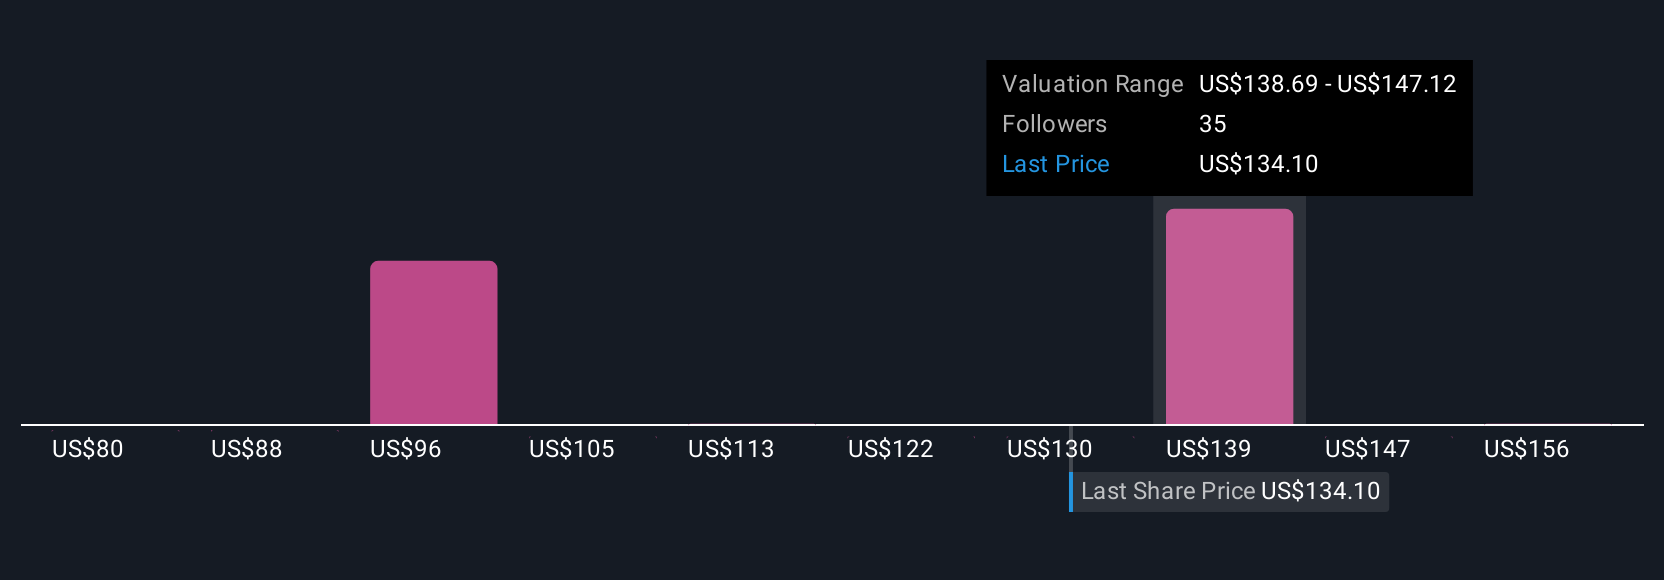
For instance, some investors forecast strong global growth and set a fair value for TJX Companies as high as $164, while others, weighing rising costs and risks, see just $88. This illustrates how Narratives reflect unique perspectives that drive real investment decisions.
Do you think there's more to the story for TJX Companies? Create your own Narrative to let the Community know!
This article by Simply Wall St is general in nature. We provide commentary based on historical data and analyst forecasts only using an unbiased methodology and our articles are not intended to be financial advice. It does not constitute a recommendation to buy or sell any stock, and does not take account of your objectives, or your financial situation. We aim to bring you long-term focused analysis driven by fundamental data. Note that our analysis may not factor in the latest price-sensitive company announcements or qualitative material. Simply Wall St has no position in any stocks mentioned.
Valuation is complex, but we're here to simplify it.
Discover if TJX Companies might be undervalued or overvalued with our detailed analysis, featuring fair value estimates, potential risks, dividends, insider trades, and its financial condition.
Access Free AnalysisHave feedback on this article? Concerned about the content? Get in touch with us directly. Alternatively, email editorial-team@simplywallst.com
About NYSE:TJX
TJX Companies
Operates as an off-price apparel and home fashions retailer worldwide.
Flawless balance sheet with solid track record.
Similar Companies
Market Insights

Advertisement
Community Narratives
Finding The True Value Of A Logistics Powerhouse
Fair Value US$95.21|8.6% undervalued
NV
Community Contributor
Paradigm Biopharmaceuticals Will Lead Osteoarthritis Treatment with Zilosul's FDA Success
Fair Value AU$5.50|91.9% undervalued
AM
Community Contributor
Barrick Mining (ABX:CA): A Gold Hedge against a U.S. Shutdown
Fair Value CA$60.00|25.6% undervalued
GM
Community Contributor